| The TreeMap User Guide is also available in PDF format. |
Introduction
Welcome to the documentation for Macrofocus Treemap.
The "Getting Started" chapter provides a brief introduction to the most important features of the application and is a good place to start for new users.
All of the features are explained in detail in the subsequent chapters.
If you don’t find what you are looking for in these pages, then you might want to look at our FAQ list, and of course you may also contact TreeMap support.
Getting started
This chapter introduces the core features of Macrofocus Treemap and is intended to help new users get started with analyzing their data.
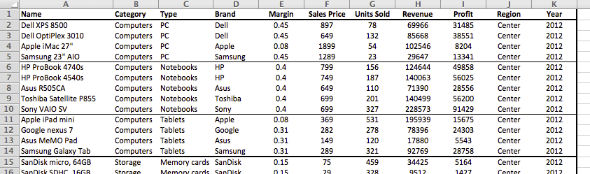
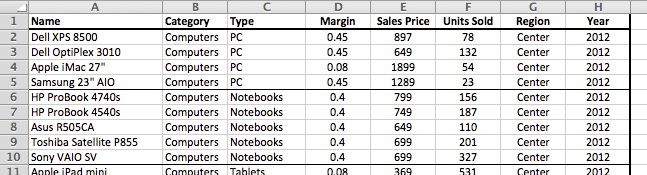
To show the main functionality, we will use the example of sales data from a store that sells consumer electronics. The products that the store sells are categorized into product categories, and within these into product types. Each product has data about its price, the margin, and the number of items sold during a year. Out of these, two additional values are computed: revenue and profit. All the data is available for three years and three different sales regions (center, North, South). Here is how this looks in a spreadsheet:
In the following sections we will show how to:
-
Load and filter the data
-
Set-up the visualization
-
View and analyze the data
-
Fine-tune the visualization
-
Export the results
Load and filter the data
Macrofocus Treemap can load data in many different formats. For our example, we chose a simple text format where the data values on a line are separated by Tab characters. This creates the least problems with special characters in the data values, is human-readable, and can be exported by all the common data tools.
The file can be opened by selecting the menu.
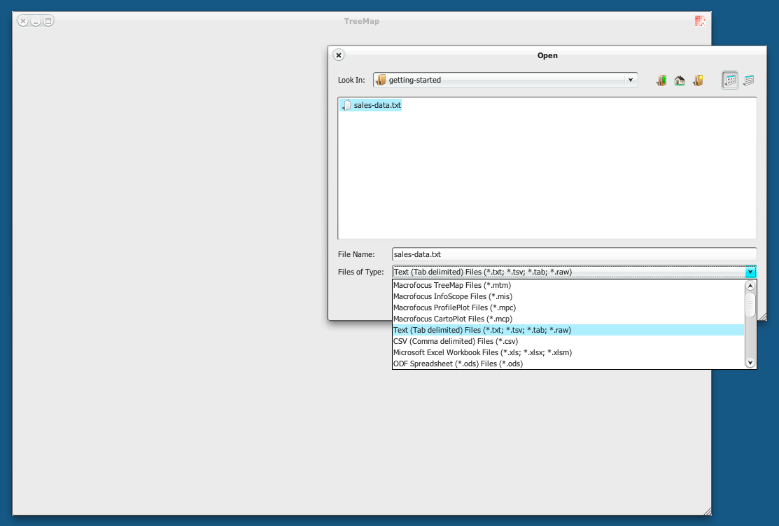
The data is then loaded and displayed with default settings.
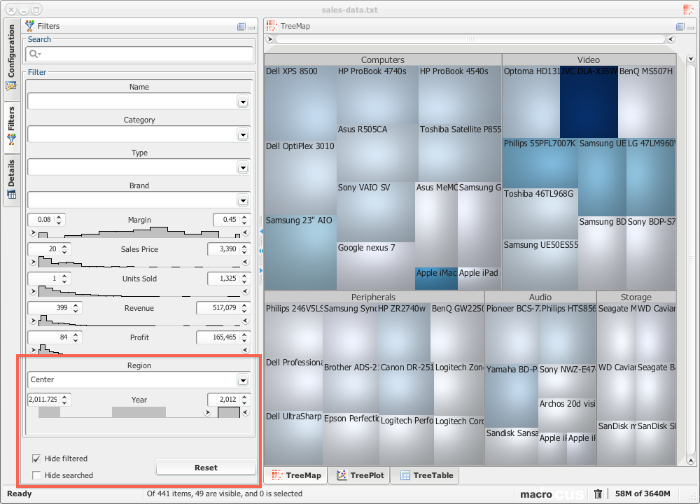
In a first step we want to limit our analysis to one year and one sales region. We therefore need to filter out the rest of the data. This can be done in the Filters panel that can be activated by clicking on the "Filters" tab along the top left of the application window. At the bottom of the Filters panel we find the two controls for Region and Year. Make sure that the "Hide filtered" check box is checked, so that the filtered-out items are removed from the visualization.
Set-up the visualization
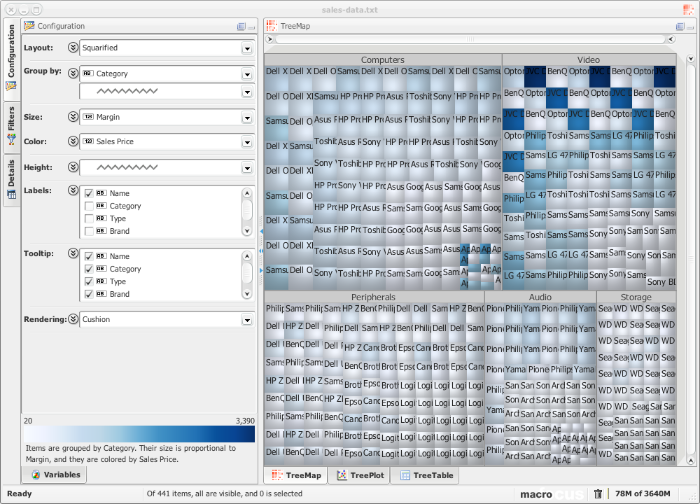
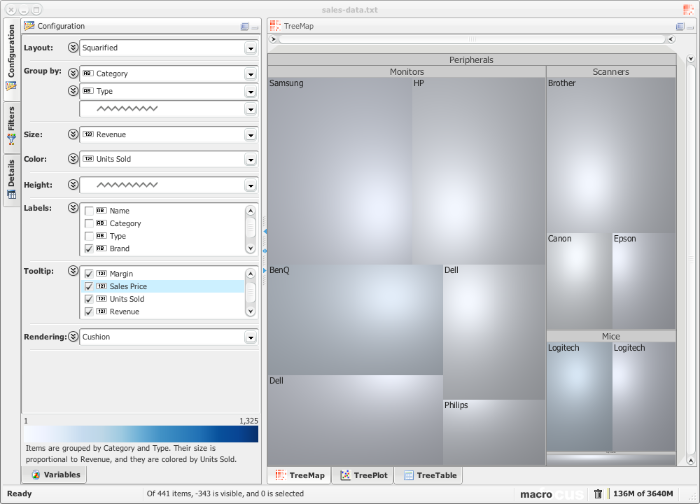
By default the data is grouped by the first categorical variable that is found in the data, in this case “Category”. We can add a second level of hierarchy to also show the grouping of product types within the product categories.
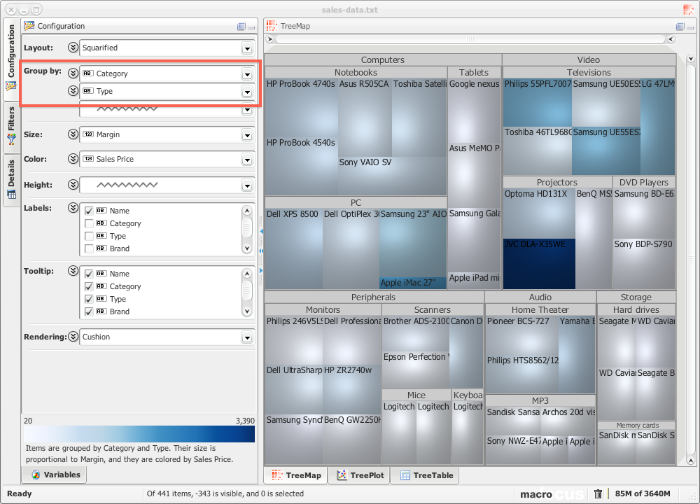
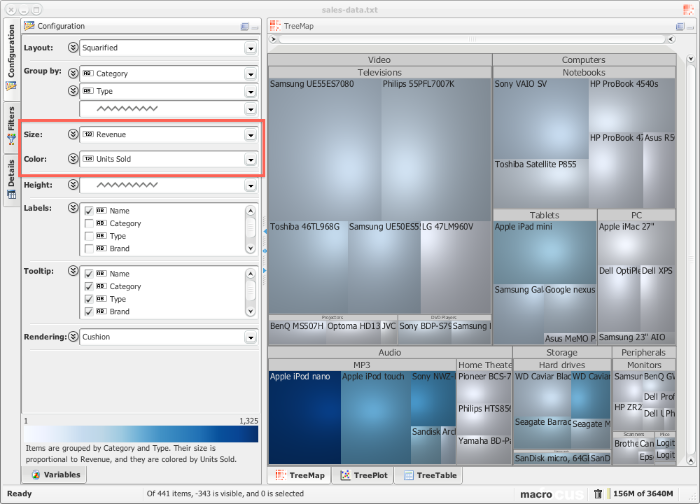
Now we turn our attention to the size and color of the rectangles. We are interested in how well the products sell in the various categories and therefore map the size of the rectangles to the variable “Revenue” and their color to “Units Sold”. The largest revenue is generated by the “Video” category, more specifically the televisions. One of the TVs sells much less units than the others but still produces comparable revenue. Products of type "MP3" sell the most units, in particular one of them, but the tablets and hard drives also have one top seller. Peripherals don’t contribute much to revenue, but there are many different products in this category that must be managed.
View and analyze the data
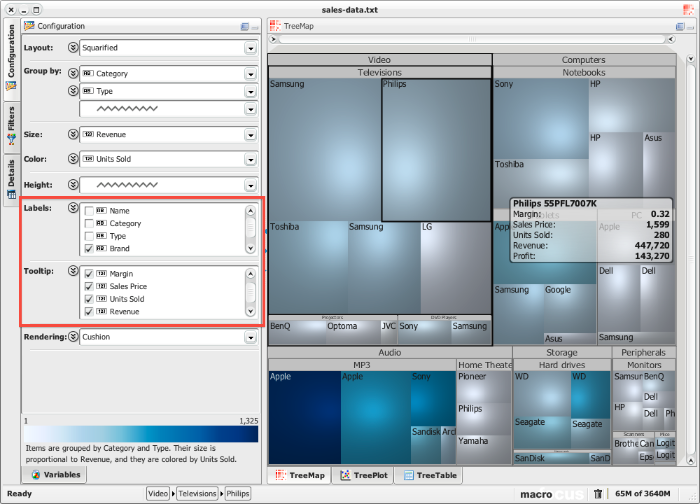
The labels in the rectangles with the product names are a bit verbose and clutter the visualization. We change this so that the label only shows the "Brand". In return, we modify what is shown in the tooltip and choose "Name" as well as all the numerical variables. This way, the full information is shown in the tooltip that opens up as we move the mouse pointer over the rectangles that we want to investigate.
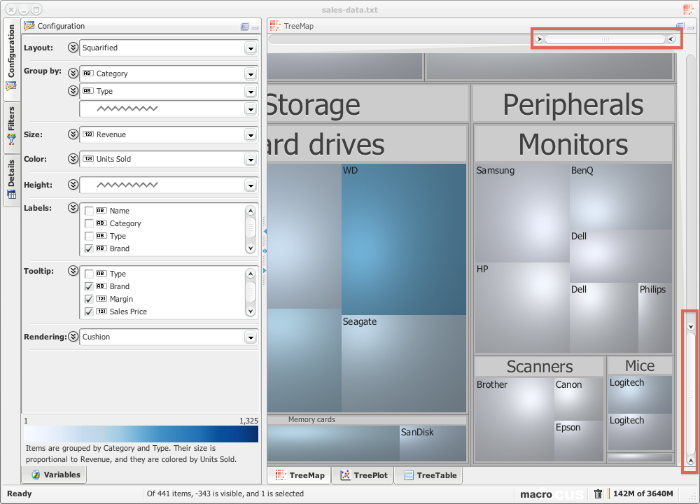
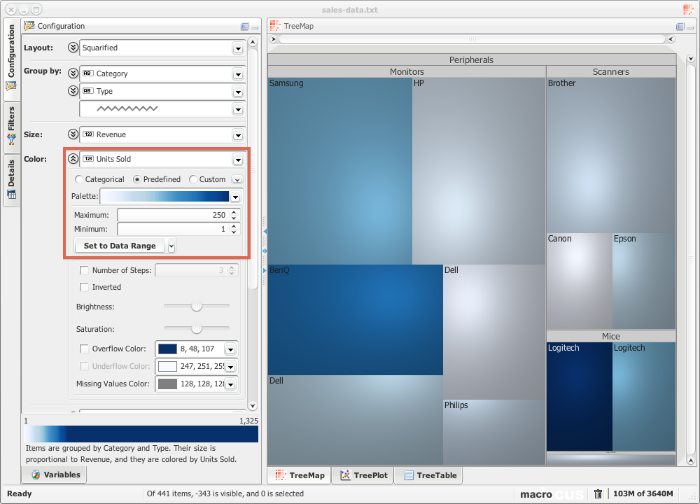
We want to further analyze the "Peripherals" category as there are many products in that category but the revenue is rather low. One way to zoom in is to use the mouse wheel or the range sliders along the top and right sides of the treemap view. While this is a quick way of making things larger, it is not optimal, as it is a purely geometrical zoom that does not take the aspect ratio of the target into account.
A better way of focusing on a sub-region is to drill down by double-clicking on the group rectangle of interest (double-click again to drill back up, or use the context menu by right-clicking anywhere). That group is then laid-out again in an optimal way.
Now the range of the colormap needs to be adjusted to the visible data. The highest value within "Peripherals" seems to be about 250 units sold, and so we set this as the maximum range in the options panel for the color.
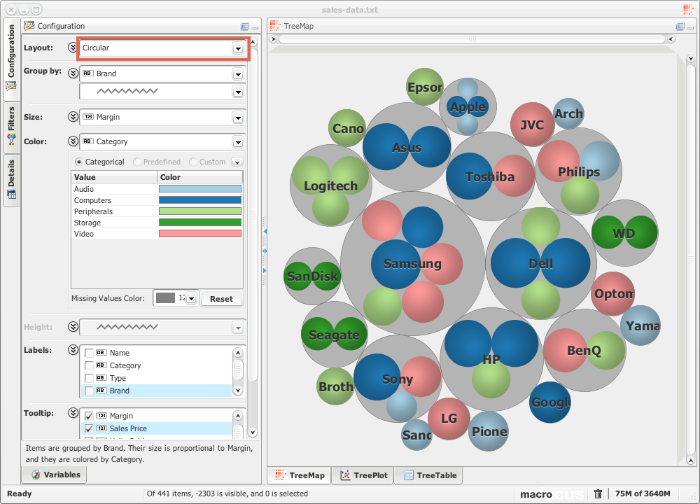
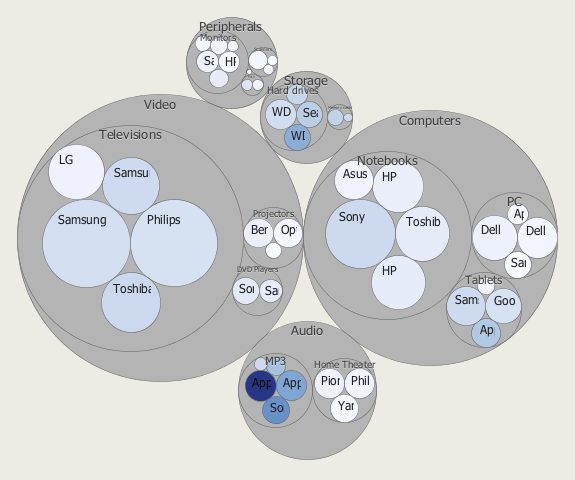
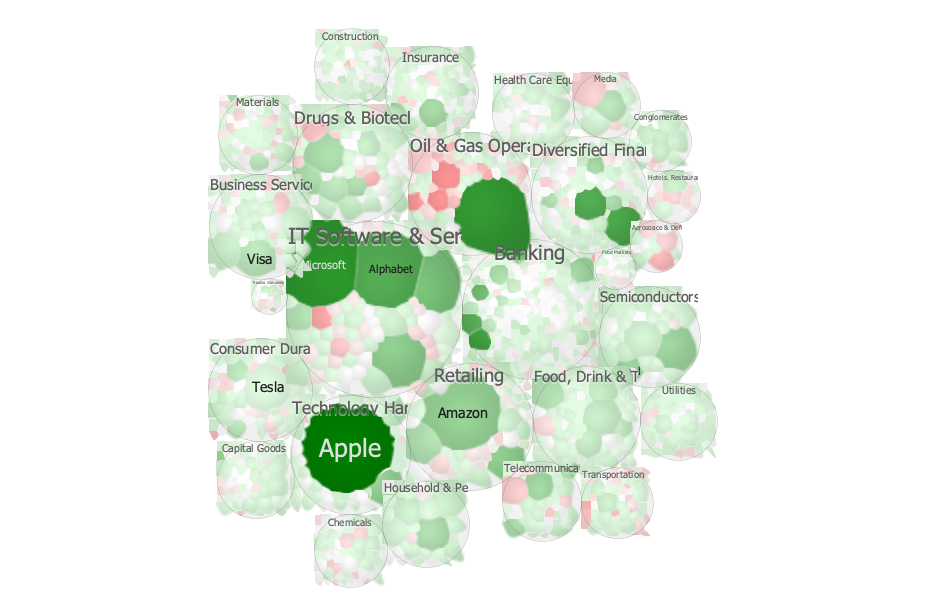
And now for something completely different: let’s find out which brand sells what kind of products. For this we choose a circular layout, because it communicates the groupings more intuitively. The items are colored by product category, and their size is proportional to the margin of a product. We can see that Samsung, Sony, and Philips have a diverse range of products. The margins are highest for computers, except for Apple that seems to be different.
Fine-tune the visualization
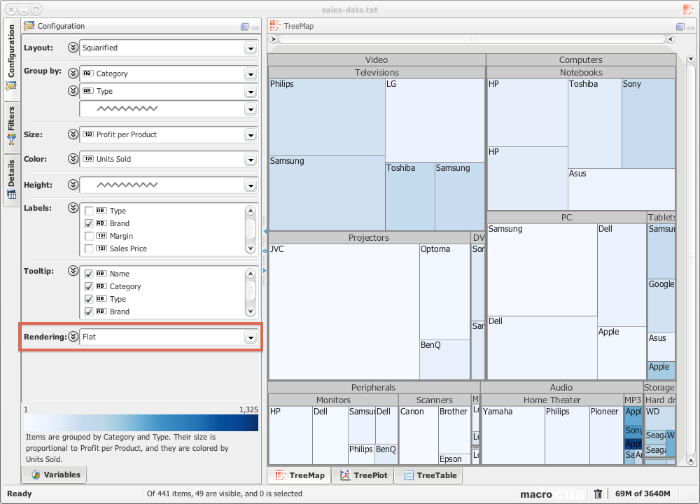
The "profit" variable measures the profit based on revenue, i.e. revenue * products sold. There is no variable that measures profit per product, i.e. price * margin. We can easily add such a variable by using the "Variables" panel at the bottom of the "Configuration" panel.
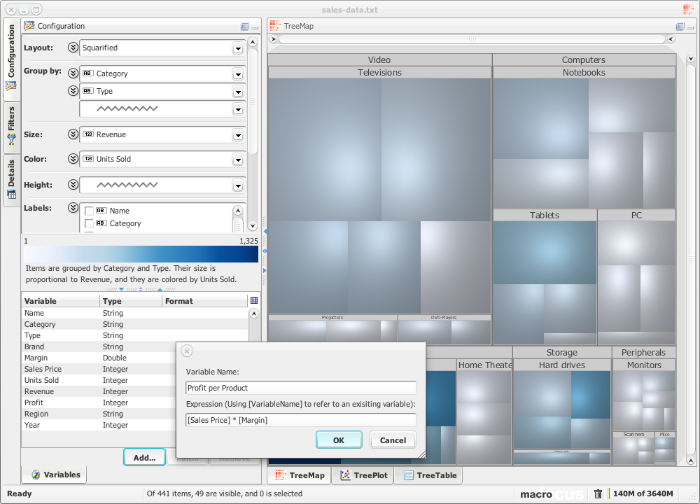
Now we can map the new variable to size and see for example that there is in particular one projector where the profit per unit sold is very high. We remove the "cushion" effect and switch to flat rendering to obtain a cleaner look.
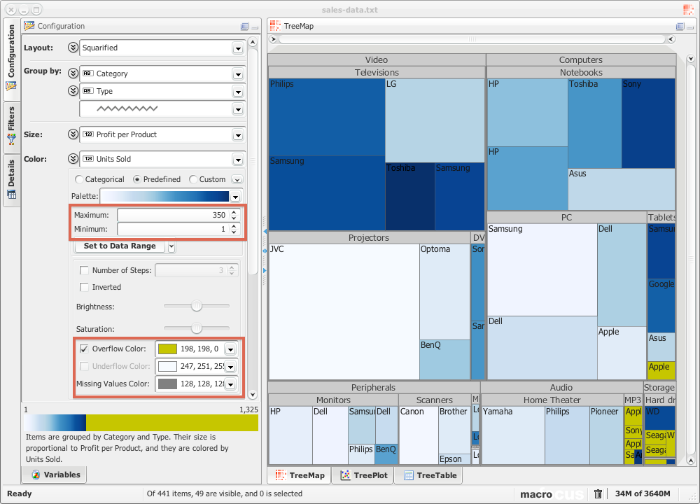
The items are colored by units sold, but to analyze the high-profit products, the colormap is not optimal yet, as the outliers in the Audio and Storage sections stretch the dynamic range. We therefore limit the range of the colormap to 350 units sold per year, and assign a special color to all the items that have higher sales.
Export the result
After all the aspects of the visualizations have been configured, all the settings together with the data can be saved to a compact file sing the menu item. The file is saved in a proprietary format with the extension “.mtm”.
If you need to export the visualization only, for example to embed it in a presentation, then this can be achieved by using the menu item. There is a choice of various pixel- or vector-based graphics formats.
Treemapping
A typical dataset describes a series of observations, where each observation is described by a number of attributes.
Let’s take for example a store that sells consumer electronics. At the end of a year, each product that the store sells is described by the number of units sold, the price of a unit, and the margin. Also, the products are categorized into categories and types (e.g. peripherals > scanners) and sales are listed by different sales regions.
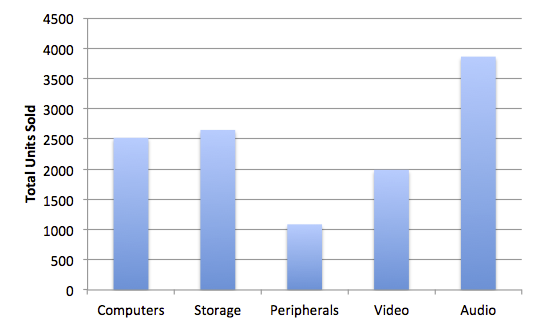
Such data is usually represented as a table where each row is an observation, and each column is a variable that describes the observations. The standard way of displaying such data is in the form of charts. Line charts for example can show the relationship between two quantitative variables (e.g. sales vs. time). Bar charts on the other hand can show the relationship between a quantitative and a categorical variable (e.g. sales vs. product category).
Often though there are more interesting relationships in the data than can be shown with these standard graphs. The data needs to be grouped by various categorical variables for example, while still showing the relationship between two quantitative variables.
In the product sales example from above, we would for instance like to see which product types produced the highest profits, what products these were, and how many units were sold.
To achieved this, each product can be mapped to a geometric shape whose size is proportional to the profit of this product, and colored by the number of units sold. The shapes are then nested into each other according to the hierarchy of product categories and types. Figure x shows this where the geometric shapes are rectangles. Each rectangle represents one product. The bigger the rectangle, the larger the profit. the darker the color, the more units were sold.
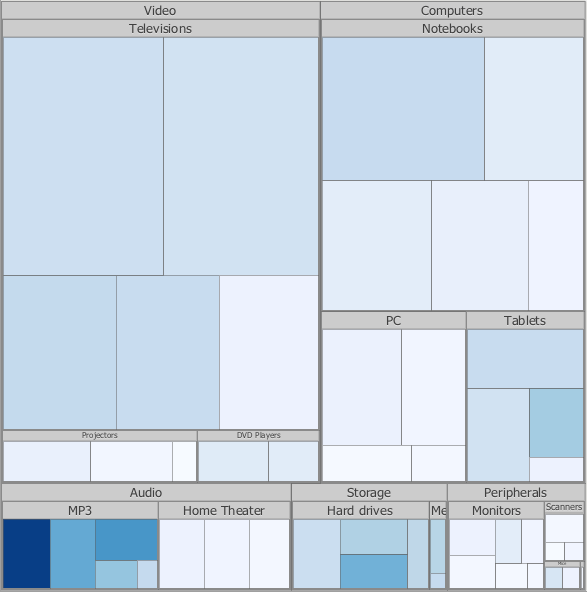
This way of displaying hierarchical quantitative data is called a Treemap. In general, a Treemap is an area-based visualization of hierarchical data using nested rectangles. Treemaps were made popular n the 90s by Ben Shneiderman [Shneiderman1992] from the University of Maryland, College Park.
Figure x shows that in the example data set, the largest profits are generated by TVs, followed by notebooks. One of the TVs (LG) sells less units than the others but still generates a good profit. Most units are sold of the "MP3" and "Hard Drive" product types.
Alternatively, one can also use circular geometric shapes and nest them. The hierarchical structure of the data thus becomes more apparent. The advantage of treemaps is that space is used efficiently and that the size of the tree nodes directly aggregate up the hierarchy.
Macrofocus Treemap provides the classic Treemap layout algorithm, but also a range of other layout algorithms in order to find the best visualization for the data and tasks at hand. All the layouts have in common that they map hierarchically structured data to proportionally sized and colored shapes that are arranged in space.
User interface

Menu and toolbars
File menu
- New
-
Creates a new empty window.
- Open…
-
Load a data file in one of the supported format.
- Open URL…
-
Load a data file in one of the supported format from a remote location.
- Open Database…
-
Load a database table or query from one of the supported datatabase system.
- Open Directory…
-
Create a dataset based on the directory structure.
- Open Google Spreadsheet…
-
Load data from Google Spreadsheet.
- Open Dataset
-
Load a dataset from High-D Server.
- Open Recent
-
Load one of the previously opened dataset.
- Reload
-
Reload the currently opened dataset, possibly retrieving updated data.
- Save
-
Save the active window in native High-D format.
- Save As…
-
Save the active window in native High-D format and give it a new file name.
- Export Graphics…
-
The current view is exported in vector or raster form in one of the following supported formats:
-
PDF (Portable Document Format) (
*.pdf) -
The resulting document is ideal for printing or inclusion in a report. It is a vector format and therefore resolution independent.
-
Scalable Vector Graphics (
*.svg) -
The resulting document is ideal for further editing and for inclusion into another document. It is a vector format and therefore resolution independent. Scalable Vector Graphics (SVG) can be displayed by many web browsers with an embedded SVG viewer, or edited by any application supporting SVG (such as Adobe Illustrator).
-
Postscript (
*.ps) -
A common vector format and therefore resolution independent. Can be used for printing.
-
EMF (Enhanced Metafile) (
*.emf) -
A resolution independent format common on the Windows platform.
-
PNG (Portable Network Graphics) (
*.png) -
A raster format.
-
JPEG (
*.jpg) -
A raster format.
-
Compuserve GIF (
*.gif) -
A raster format.
-
TIFF (Tagged Image File Format) (
*.tiff) -
A raster format.
-
PDF (Portable Document Format) (
| All the raster export format allow for setting the desired DPI for high-quality output. |
- Export Data…
-
The data visible in the TreeTable view can be exported with for further processing in spreadsheet programs or other applications. The following formats are supported:
-
CSV (Commad Delimited) (
*.csv) -
The comma-separated values (CSV) format stores tabular data (numbers and text) in plain-text form. Most spreadsheet and data management software are able to import data in this format.
-
Text (Tab Delimited) (
*.txt;*.tsv;*.tab;*.raw) -
The tab-separated values format is a popular method of data interchange among databases and spreadsheets. It stores tabular data (numbers and text) in plain-text form.
-
Microsoft Excel Workbook (
*.xls;*.xlsx;*.xlsm) -
The comma-separated values (CSV) format stores tabular data (numbers and text) in plain-text form. Most spreadsheet and data management software are able to import data in this format.
-
Apache Arrow (
*.arrow) -
The Arrow format stores tabular data (numbers and text) in form that allow data access without serialization overhead.
-
Apache Parquet (
*.parquet) -
The Parquet format stores tabular data (numbers and text) in a compressed, efficient columnar data representation. It is popular in the Hadoop ecosystem.
-
CSV (Commad Delimited) (
- Export 3D Model…
-
The treemap visualization can be exported as a 3D model in the following formats:
-
X3D (
*.x3d) -
X3D is a ISO/IEC standard for declaratively representing 3D computer graphics.
-
VRML (
*.wrl) -
VRML is a standard file format for representing 3D interactive vector graphics. It has been superseded by X3D.
-
X3DOM (
*.html) -
Using X3DOM, the scene is directly written into an HTML.
-
X3D (
- Import Settings…
-
All the settings can be exported using
- Export Settings…
-
Settings saved using can be applied to another dataset using
- Page Setup…
-
Setup the formatting of the page.
- Print…
-
Print the current window.
- Close
-
Close the current window.
- Exit
-
Quit the TreeMap application.
Edit menu
- Reset
-
Reset the views to their default.
- Copy Graphics
-
Copy graphics to the clipboard.
Options menu
- Hide Filtered
-
Hide filtered objects
- Look and Feel
-
Change the look and feel of the application
Window menu
- Full Screen
-
Go into full-screen mode
Help menu
- TreeMap Help
-
Read the TreeMap documentation
- Check for Update…
-
Check for new version of the software
- Register…
-
Register the license key
- About TreeMap…
-
Obtains information about the current version of TreeMap
Status bar
Loading data
TreeMap offers the possibility of loading data in various formats and from multiple data sources. The most common ways of importing your own data is to use tab-delimited or comma-separated files, as well as Excel workbooks. Connectivity to common relational databases and some on-line data providers is also provided.
File-based data sources
To load data files, either
-
use the menu entry. This will open a dialog to select the file to open:
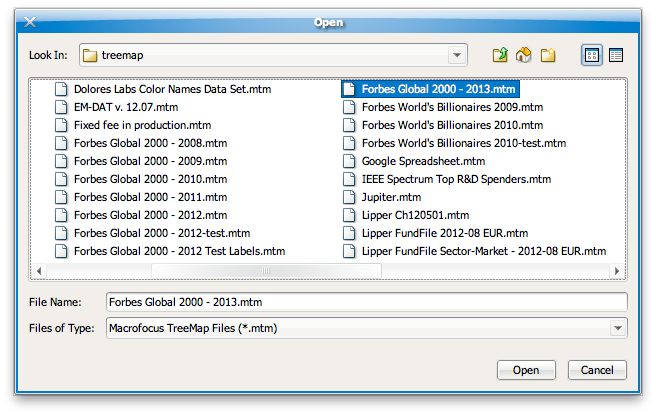 Figure 21. File chooser dialog for selecting a data file
 -
drag and drop a file with a known file extension onto the TreeMap application frame,
-
or double-click on the file if its extension is registered to TreeMap.
Macrofocus TreeMap (*.mtm)
This is the native format used by TreeMap. It can be used to store both a copy of the actual data, its original data source, as well as all the configurations made using the TreeMap application. The data are stored in a highly compressed binary format to reduce the file size and all the configuration information in XML format. For a detailed technical specification of the data format, please contact us.
Text (Tab delimited) (*.txt;*.tsv;*.tab;*.raw)
Loading data from tab-delimited text files should be pretty straightforward. TreeMap expects the first line to contain the name of each column, using the tab character to separate each column.
The tab-separated values format is a popular method of data interchange among databases and spreadsheets. It stores tabular data (numbers and text) in plain-text form. While it is a loosely defined format (even though IANA attempts to standardize it), TreeMap automatically detects its encoding, the type of data values, and handles smoothly all the most common causes of errors. Tab-delimited files are processed similarly to comma-delimited files, except that they use the tabulator character to separate each column.
TreeMap expects the first line as a header to contain names corresponding to the columns in the file. These values will be used to name each of the variables. Each record is then located on a separate line. The values between each column are delimited by tabs. Each record "should" contain the same number of tab-separated fields. Any field may be quoted (with double quotes). Fields containing a line-break, double-quote, and/or tab should be quoted. A (double) quote character in a field must be represented by two (double) quote characters.
After the file has been loaded, TreeMap will attempt to detect the data type of each column. Automatically recognized types are text (String), numbers (Integer and Double) and some more specialized types such as dates (supported formats are "MM/dd/yyyy", "MM/dd/yy", "yyyy-MM-dd", "dd.MM.yyyy HH:mm:ss"), URLs, geometries (in WKT format), and binary data (in Base64 format).
As an example, the following text file
Planet  Region  Spherical area  Radius in km    Discovery date  Wikipedia article
Mercury Inner Solar System  18688458.19 2439        http://en.wikipedia.org/wiki/Mercury_(planet)
Venus   Inner Solar System  115066184.2 6052        http://en.wikipedia.org/wiki/Venus
Earth   Inner Solar System  127796483.1 6378        http://en.wikipedia.org/wiki/Earth
Mars    Inner Solar System  36274097.98 3398        http://en.wikipedia.org/wiki/Mars
Jupiter Outer Solar System  16014816458 71398       http://en.wikipedia.org/wiki/Jupiter
Saturn  Outer Solar System  11309733553 60000       http://en.wikipedia.org/wiki/Saturn
Uranus  Outer Solar System  2026829916  25400   3/13/1781   http://en.wikipedia.org/wiki/Uranus
Neptune Outer Solar System  1855079046  24300   9/23/1846   http://en.wikipedia.org/wiki/Neptune
Pluto   Outer Solar System  7547676.35  1550    2/18/1930   http://en.wikipedia.org/wiki/Pluto
will result in the following table being loaded in TreeMap:
|
Planet |
Region |
Spherical area |
Radius in km |
Discovery date |
Wikipedia article |
|
|
|
|
|
|
|
|
Mercury |
Inner Solar System |
18688458.19 |
2439 |
||
|
Venus |
Inner Solar System |
115066184.2 |
6052 |
||
|
Earth |
Inner Solar System |
127796483.1 |
6378 |
||
|
Mars |
Inner Solar System |
36274097.98 |
3398 |
||
|
Jupiter |
Outer Solar System |
16014816458 |
71398 |
||
|
Saturn |
Outer Solar System |
11309733553 |
60000 |
||
|
Uranus |
Outer Solar System |
2026829916 |
25400 |
3/13/1781 |
|
|
Neptune |
Outer Solar System |
1855079046 |
24300 |
9/23/1846 |
|
|
Pluto |
Outer Solar System |
7547676.35 |
1550 |
2/18/1930 |
While TreeMap will autodetect the character encoding used for representing international and special characters beyond ASCII characters, it is recommended to use the Unicode standards (typically UTF-8 or UTF-16).
To force TreeMap to parse values for a specific data type, an optional second header line can be inserted. The second line can optionally contain information about the type of values to be expected for each column. Possible types are "String" for any type of textual information, "Integer" for numbers without a fractional or decimal component, "Float" and "Double" for single and double precision floating-point numbers, and "Color" to provide color information. Each subsequent lines should contain the respective values for each of the columns.
As an example, you can download the Forbes Global 2000 dataset in this format.
After the data file has been loaded into TreeMap, it will automatically attempt to create a default configuration.
CSV (Comma delimited) (*.csv)
The comma-separated values (CSV) format stores tabular data (numbers and text) in plain-text form. Most spreadsheet and data management software are able to export data in this format. While it is a loosely defined format (even though RFC 4180 attempts to standardize it), TreeMap automatically detects its encoding, the type of data values, and handles smoothly all the most common causes of errors. Comma-delimited files are processed similarly to tab-delimited files, except that they use a comma (or semicolon) to separate each column.
TreeMap expects the first line as a header to contain names corresponding to the columns in the file. These values will be used to name each of the variables. Each record is then located on a separate line. The values between each column are delimited by commas (or semicolons). Each record "should" contain the same number of comma-separated fields. Any field may be quoted (with double quotes). Fields containing a line-break, double-quote, and/or commas should be quoted. A (double) quote character in a field must be represented by two (double) quote characters.
After the file has been loaded, TreeMap will attempt to detect the data type of each column. Automatically recognized types are text (String), numbers (Integer and Double) and some more specialized types such as dates (supported formats are "MM/dd/yyyy", "MM/dd/yy", "yyyy-MM-dd", "dd.MM.yyyy HH:mm:ss"), URLs, geometries (in WKT format), and binary data (in Base64 format).
As an example, the following text file
Planet,Region,Spherical area,Radius in km,Discovery date,Wikipedia article
Mercury,Inner Solar System,18688458.19,2439,,http://en.wikipedia.org/wiki/Mercury_(planet)
Venus,Inner Solar System,115066184.2,6052,,http://en.wikipedia.org/wiki/Venus
Earth,Inner Solar System,127796483.1,6378,,http://en.wikipedia.org/wiki/Earth
Mars,Inner Solar System,36274097.98,3398,,http://en.wikipedia.org/wiki/Mars
Jupiter,Outer Solar System,16014816458,71398,,http://en.wikipedia.org/wiki/Jupiter
Saturn,Outer Solar System,11309733553,60000,,http://en.wikipedia.org/wiki/Saturn
Uranus,Outer Solar System,2026829916,25400,3/13/1781,http://en.wikipedia.org/wiki/Uranus
Neptune,Outer Solar System,1855079046,24300,9/23/1846,http://en.wikipedia.org/wiki/Neptune
Pluto,Outer Solar System,7547676.35,1550,2/18/1930,http://en.wikipedia.org/wiki/Pluto
will result in the following table being loaded in TreeMap:
|
Planet |
Region |
Spherical area |
Radius in km |
Discovery date |
Wikipedia article |
|
|
|
|
|
|
|
|
Mercury |
Inner Solar System |
18688458.19 |
2439 |
||
|
Venus |
Inner Solar System |
115066184.2 |
6052 |
||
|
Earth |
Inner Solar System |
127796483.1 |
6378 |
||
|
Mars |
Inner Solar System |
36274097.98 |
3398 |
||
|
Jupiter |
Outer Solar System |
16014816458 |
71398 |
||
|
Saturn |
Outer Solar System |
11309733553 |
60000 |
||
|
Uranus |
Outer Solar System |
2026829916 |
25400 |
3/13/1781 |
|
|
Neptune |
Outer Solar System |
1855079046 |
24300 |
9/23/1846 |
|
|
Pluto |
Outer Solar System |
7547676.35 |
1550 |
2/18/1930 |
While TreeMap will autodetect the character encoding used for representing international and special characters beyond ASCII characters, it is recommended to use the Unicode standards (typically UTF-8 or UTF-16).
To force TreeMap to parse values for a specific data type, an optional second header line can be inserted. The second line can optionally contain information about the type of values to be expected for each column. Possible types are "String" for any type of textual information, "Integer" for numbers without a fractional or decimal component, "Float" and "Double" for single and double precision floating-point numbers, and "Color" to provide coloring information. Each subsequent line should contain the respective values for each of the columns.
As an example, you can download the Forbes Global 2000 dataset in this format.
After the data file has been loaded into TreeMap, it will automatically attempt to create a default configuration.
Microsoft Excel Workbook (*.xls;*.xlsx;*.xlsm)
TreeMap can read files produced by Microsoft Excel, including the recent Office Open XML format, even without having Excel installed on the local computer. The first row is expected to contain the name of each column. If the workbook contains multiple sheets, a dialog allows to choose which one should be loaded by TreeMap.
To force TreeMap to parse values for a specific data type, an optional second header line can be inserted. The second line can optionally contain information about the type of values to be expected for each column. Possible types are "String" for any type of textual information, "Integer" for numbers without a fractional or decimal component, "Float" and "Double" for single and double precision floating-point numbers, and "Color" to provide color information. Each subsequent line should contain the respective values for each of the columns.
As an example, you can download the Forbes Global 2000 dataset in this format.
ODF Spreadsheet (*.ods)
TreeMap can read files in the native OpenOffice and LibreOffice format.
SPSS (*.sav)
TreeMap can read files in the native SPSS format.
SAS (*.sas7bdat)
TreeMap can read files in the native SAS format.
HCIL TM3 (*.tm3)
For backward compatibility, files can be loaded in the data format used by the University of Maryland Treemap. A description of the actual data format is provided on the HCIL website.
TreeML (*.treeml)
For backward compatibility, files can be loaded in the TreeML file format. A description of the actual data format is provided on the HCIL website.
Microsoft Project (*.mpp)
TreeMap can read files in the native Microsoft Project format.
Microsoft Project Exchange (*.mpx)
Handled identically to the Microsoft Project format.
Microsoft Project Data Interchange (*.xml)
Handled identically to the Microsoft Project format.
Zip Archive (*.zip)
This will analyze the content of the archive, including its hierarchical structure. A typical use is to find which files and directories are taking up space in the archive.
Java Archive (*.jar;*.war)
Handled identically to the Zip Archive format.
Text Document (*.text)
This will analyze the text, compute word count statistics, and open the results as a tag cloud.
Web page (*.html)
Handled identically to the Text Document format.
ESRI Shapefile (*.shp)
This is a popular geospatial vector data format for geographic information systems (GIS) software. Shapefiles spatially describe features: points, lines, and polygons, representing, for example, water wells, rivers, and lakes. Each item usually has attributes that describe it, such as name or temperature.
Apache Arrow (*.arrow)
TreeMap can read files in the Apache Arrow format.
Apache Parquet (*.parquet)
TreeMap can read files in the Apache Parquet format.
Microsoft Access (*.mdb;*.accdb)
Access database tables can directly be loaded into TreeMap. However, this is only supported on the Windows platform and requires Microsoft Access or the Microsoft Access Database Engine to be installed.
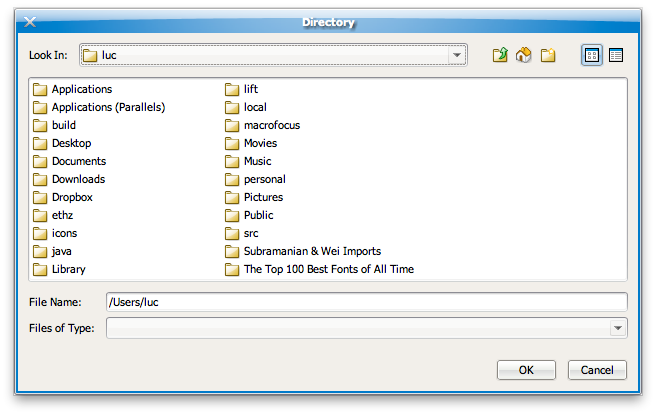
Directory-based data sources
Because a treemap representation is an excellent visualization for finding out which files and directories take space on a computer hard disk, TreeMap provides the possibility of scanning the directory structure of your file system by choosing and then specifying the location of the root directory. The following dialog is presented to select the directory:
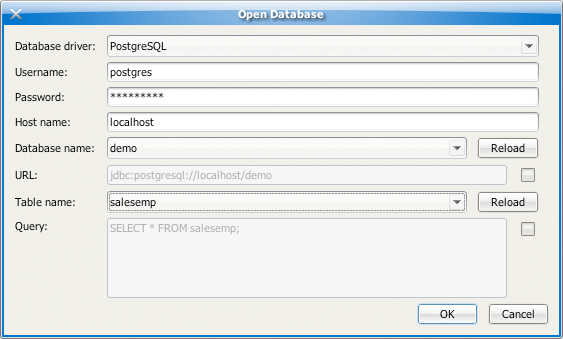
Database connectivity
TreeMap can directly import data from popular relational database servers installed on the local computer or on a remote machine. Currently supported are:
-
MySQL
-
Oracle
-
Microsoft SQL Server
-
PostgreSQL
-
IBM DB2
-
SAP MaxDB
-
PostGIS
Please contact support if your database system is not currently supported. Any data source queryable through a JDBC driver can easily be integrated into TreeMap.
Microsoft Access is also supported, but as a file-based data source.
To start importing data from a database, go to . This will open a dialog to define the required parameters:
On-line data sources
Stock quotes data from Yahoo Finance can directly be access through the submenu, as well as all the example datasets provided on our website. This menu entry also provides integration withTreeMap Server.
Automatic default configuration
By default, TreeMap automatically assigns the first categorical variable to the label, the second categorical variable (if available) to the grouping, the first numerical variable to the size, and the second numerical variable (if available) to the color.
Data types
All data types support null (blank) values. Supported types are:
Text
-
String -
Represents character strings such as "abc".
-
StringPath -
Represents an array of character strings. Values should be delimited by commas.
-
HtmlString -
Represents a tagged string in HTML format.
Numbers
-
Byte -
The Byte data type is an 8-bit signed two’s complement integer. It has a minimum value of -128 and a maximum value of 127 (inclusive).
-
Short -
The short data type is a 16-bit signed two’s complement integer. It has a minimum value of -32,768 and a maximum value of 32,767 (inclusive).
-
Integer -
The Integer data type is a 32-bit signed two’s complement integer. It has a minimum value of -2,147,483,648 and a maximum value of 2,147,483,647 (inclusive). For integral values, this data type is generally the default choice unless there is a reason (like the above) to choose something else. This data type will most likely be large enough for the numbers your program will use, but if you need a wider range of values, use Long instead.
-
Long -
The Long data type is a 64-bit signed two’s complement integer. It has a minimum value of -9,223,372,036,854,775,808 and a maximum value of 9,223,372,036,854,775,807 (inclusive). Use this data type when you need a range of values wider than those provided by Integer.
-
Float -
The Float data type is a single-precision 32-bit IEEE 754 floating point. Its range of values is beyond the scope of this discussion, but it can typically handle more than 7 decimal digits. This data type should never be used for precise values, such as currency. For that, you will need to use the BigDecimal type instead.
-
Double -
The Double data type is a double-precision 64-bit IEEE 754 floating point. Its range of values is beyond the scope of this discussion, but it can typically handle more than 15 decimal digits. For decimal values, this data type is generally the default choice. As mentioned above, this data type should never be used for precise values, such as currency.
-
BigDecimal -
An arbitrary-precision signed decimal number.
-
StringDouble -
A Double data type with support for formatting patterns.
Others
-
Boolean -
The Boolean data type has only two possible values: true and false. Use this data type for simple flags that track true/false conditions. This data type represents one bit of information.
-
Date -
Represents a specific instant in time, with millisecond precision.
-
Color -
The Color data type is used to encapsulate colors in the default sRGB color space. Every color has an implicit alpha value of 1.0 or an explicit one provided in the constructor. The alpha value defines the transparency of a color and can be represented by a float value in the range 0.0 - 1.0 or 0 - 255. An alpha value of 1.0 or 255 means that the color is completely opaque and an alpha value of 0 or 0.0 means that the color is completely transparent. When constructing a Color with an explicit alpha or getting the color/alpha components of a Color, the color components are never premultiplied by the alpha component.
-
Icon -
A small fixed size picture, typically used to decorate components.
-
Image -
Represents graphical images.
-
URL -
The URL data type represents a Uniform Resource Locator, a pointer to a "resource" on the World Wide Web. A resource can be something as simple as a file or a directory, or it can be a reference to a more complicated object, such as a query to a database or to a search engine. More information on the types of URLs and their formats can be found in the URL Specification.
-
File -
A representation of file and directory pathnames.
-
byte[] -
For binary data.
-
Geometry -
Represents geometric information, such as points, lines, and polygons.
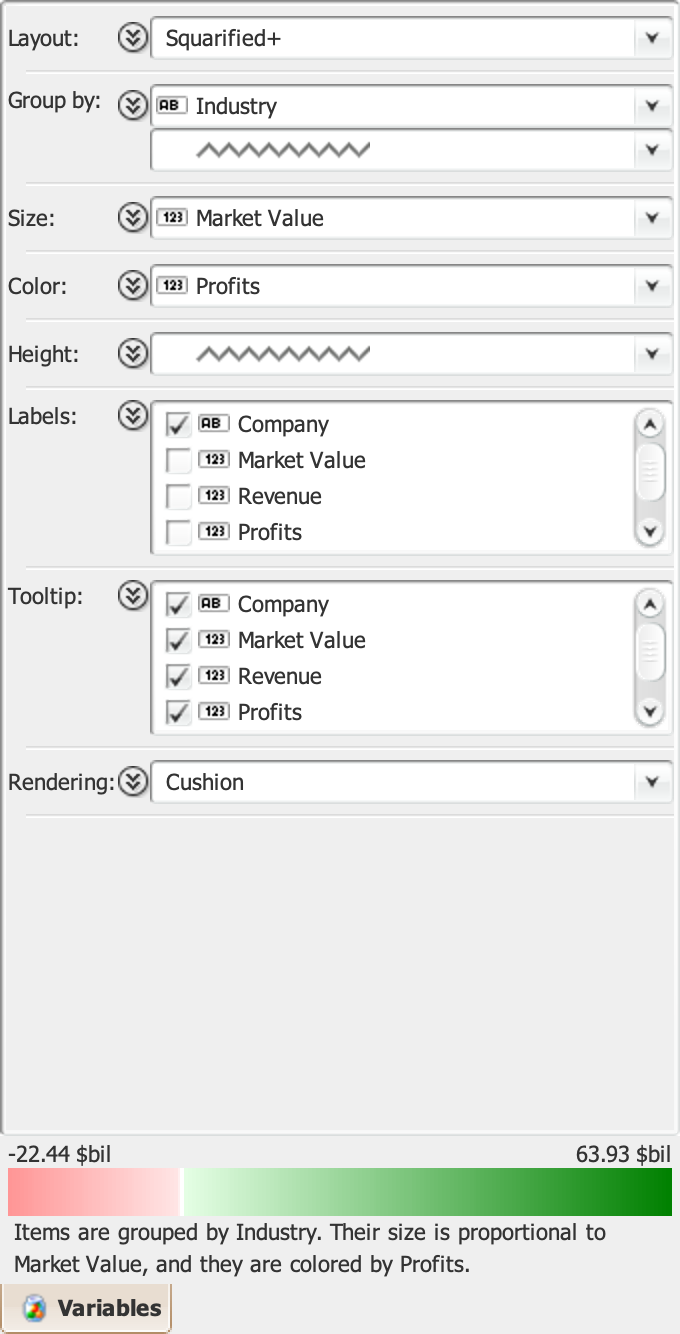
Configuration panel
TreeMap possesses a powerful layout, data processing, and rendering engine that offers a vast choice of customization possibilities. The configuration panel gives instant access to all the key settings, where each section can be further expanded to expose the full palette of choices to fine-tune the appearance of the resulting treemap view.
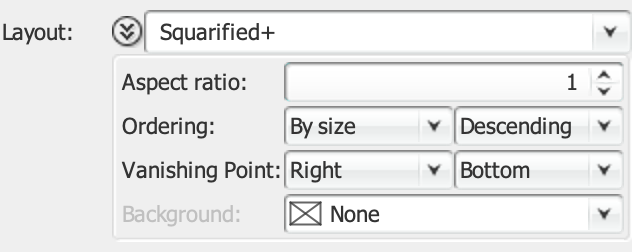
Layout
TreeMap offers a full set of the most successful tiling algorithms, which differ in the aspect ratio of the composing shapes, their ability to maintain order, and their stability with respect to changes in the data… and of course their readability, performance, and aesthetic properties.
| All the settings under Layout can be overridden on a per-variable basis in the Group by pane. |
- Binary Tree
-
The Binary Tree tiling should be considered when the layout stability is extremely important. While not having shapes with very good aspect ratios, it is very stable when changes occur in the data.

- Slice-and-dice
-
Invented in 1991, this was the first treemap layout algorithm. Its biggest problem being poor aspect ratios, the tiling becomes less useful for large datasets or screen real estate. For each level, the layout direction is changed between horizontal and vertical, and the display is proportionally divided amongst the children.
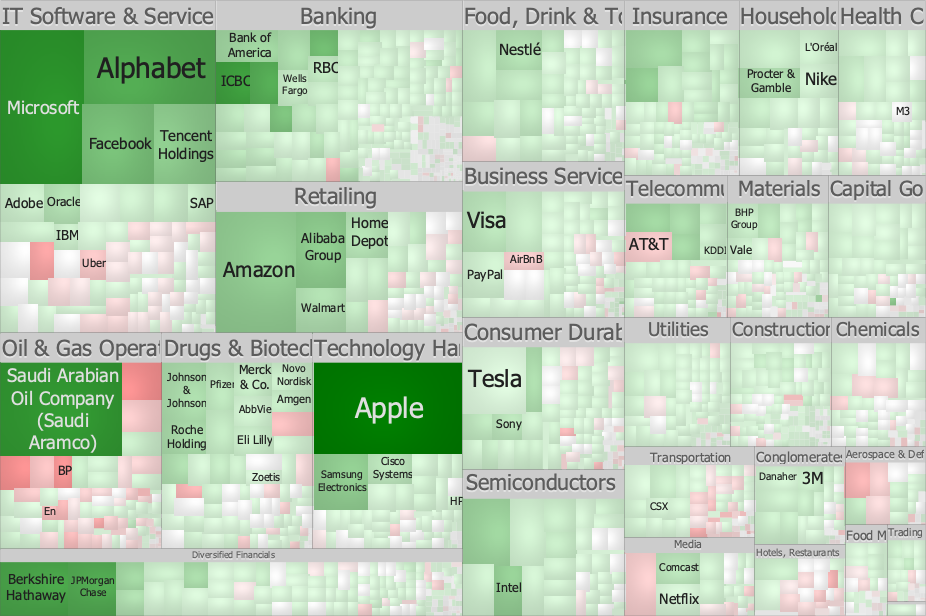
- Squarified
-
The most popular layout algorithm, it seeks a tiling where all rectangles have an aspect ratio as close to one as possible (i.e. a square).

- Squarified+
-
Probably the best general purpose layout algorithm, it seeks a tiling where all rectangles have an aspect ratio as close to one as possible (i.e. a square).

- Strip
-
This is a variation of the Squarified layout algorithm, and differs because the layout direction is fixed from the start. One of its key strengths, other than its natural tiling that produces excellent readability, is that it is ordered and can therefore have its content organized in a predictable way.

- Pivot by Split Size
-
Being a partially ordered algorithm, the readability is better than the Squarified treemap, although not as good as the Strip layout, which follows a simple linear pattern.
- Split
-
This algorithm tries to satisfy the dual goals of a good aspect ratio for the rectangles, and minimal changes to the order of the items in the treemap.

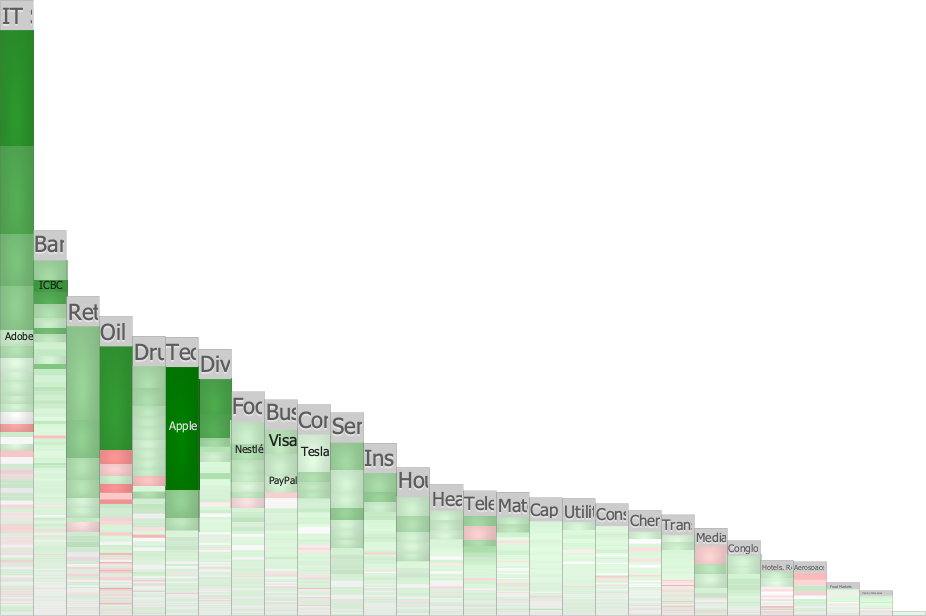
- Bar Chart
-
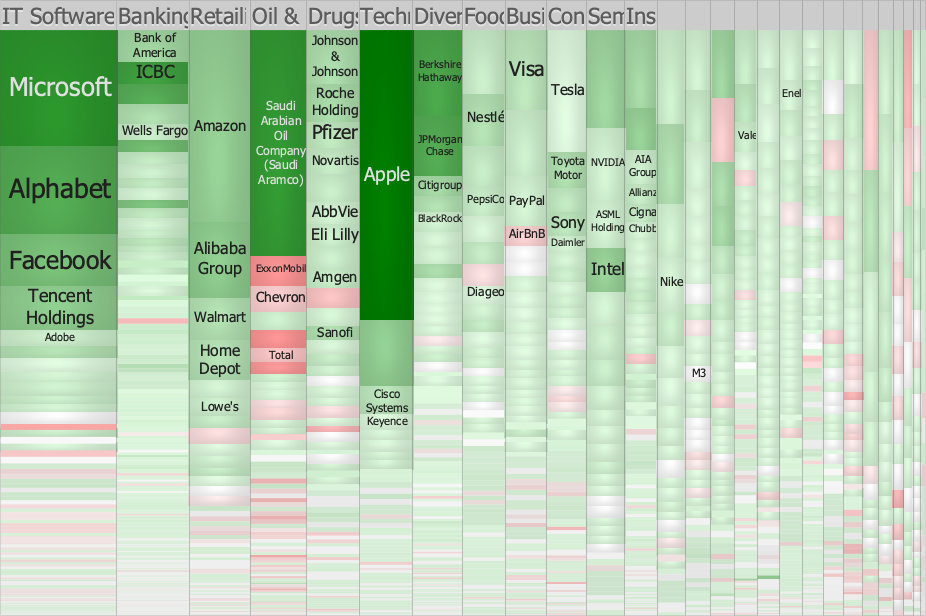
While a bar chart makes no attempt to fill the available space, as this is the case for all the treemap layouts, the length of the bars are proportional to the values they represent. It is nevertheless very useful when then sizes need to be compared visually or when dealing with time series.
Stacked bar charts can be created by combining this layout with the slice layout.
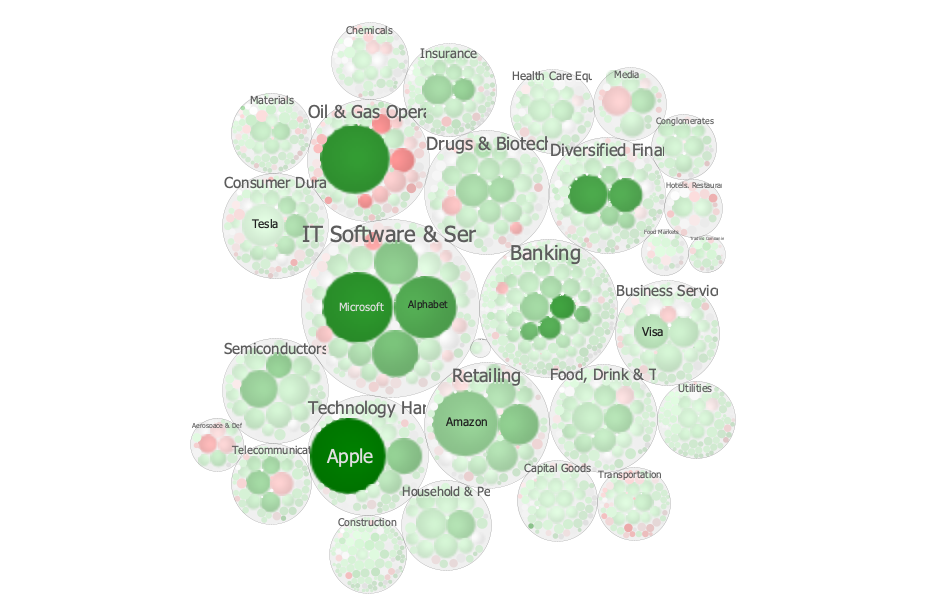
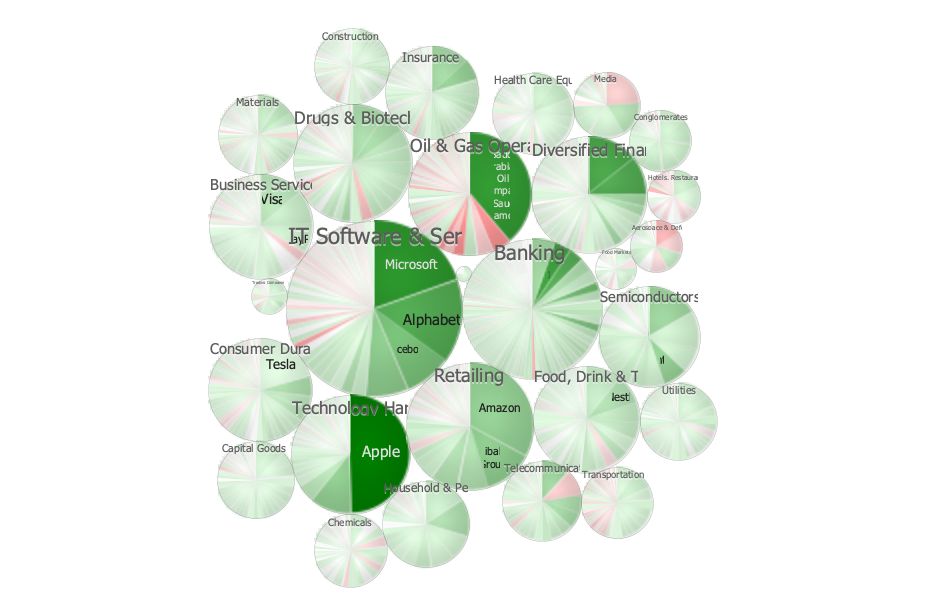
- Circular
-
The circular layout uses nested circles. While the representation is very attractive from an aesthetic standpoint, it doesn’t fill the available space completely and the size of the groups cannot be accurately compared.
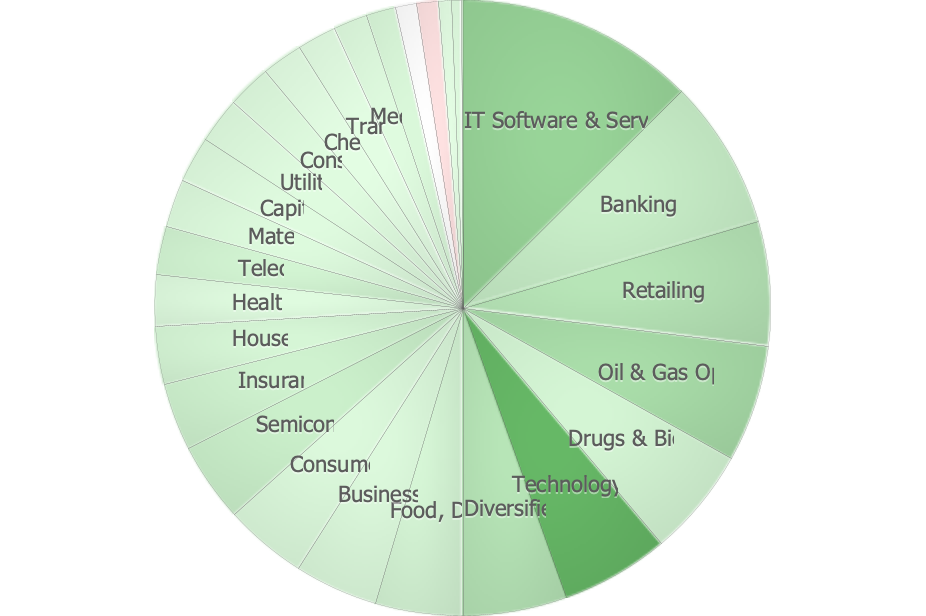
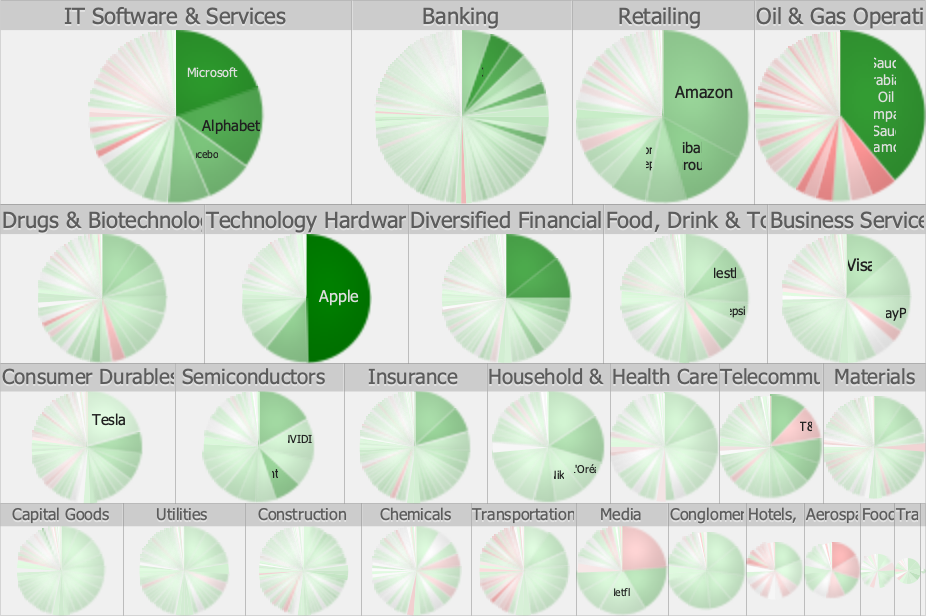
- Pie Chart
-
A pie chart is a circular chart divided into sectors. The arc length, and consequently the area, is proportional to the quantity it represents. While being controversial, pie charts are very widely used in the business world and can be used effectively for small number of items or when nested inside a circular layout.
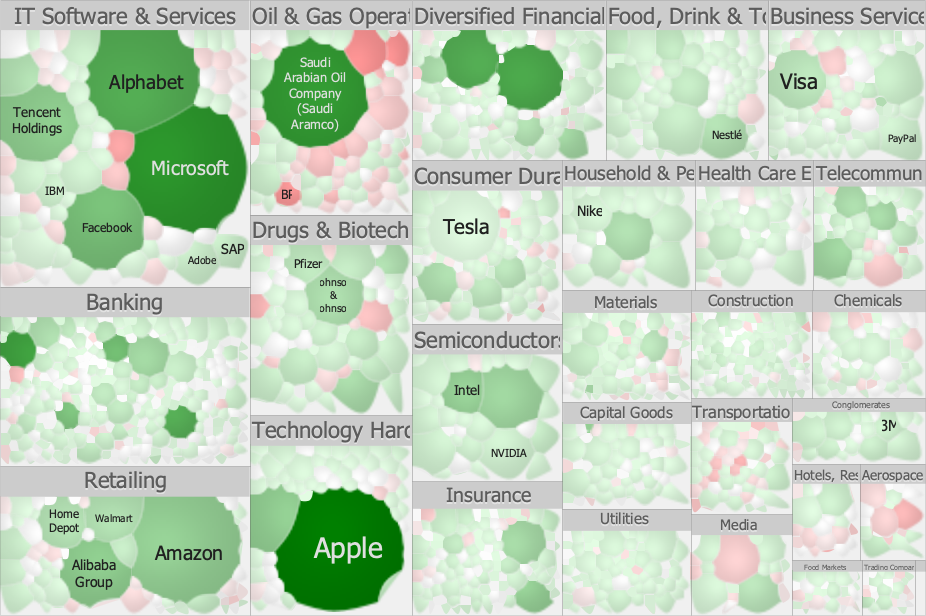
- Voronoi
-
The Voronoi layout algorithm uses polygons instead of rectangles, resulting in good aspect ratios and an appealing organic look.

- Tag Cloud
-
Tag clouds represent entries as labels where the size of the font is proportional to the value associated with each entry

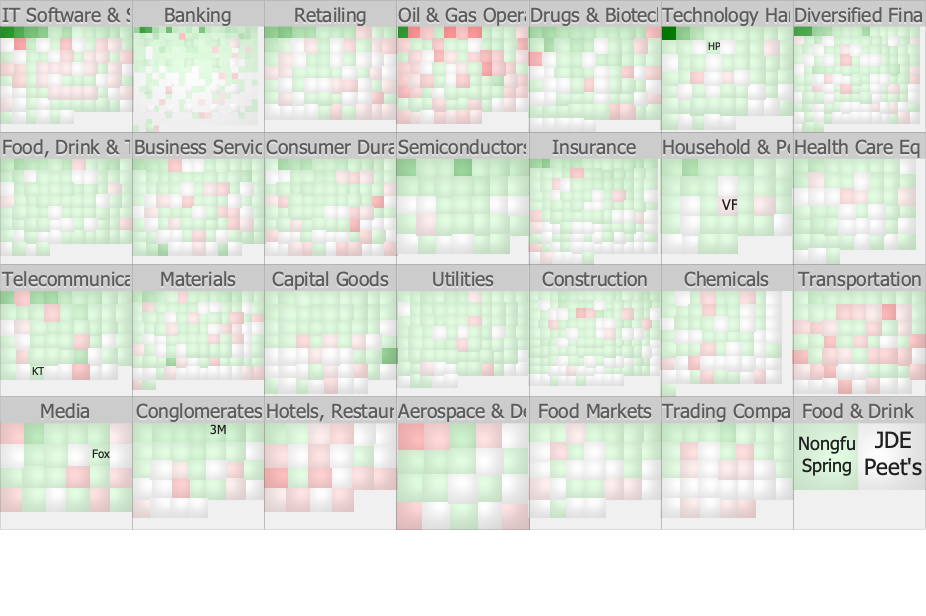
- Matrix
-
The matrix layout decomposes the space into equally sized squares. Note that is doesn’t take into account the Size that has been specified.
- Ordering
-
This option allows to set the order in which the items should be laid out. Only ordered layouts will fully honor this setting (in particular the Slice-and-dice and Strip layouts).
- Vanishing Point
-
The smallest shape can be horizontally placed at the left, center, or right of the group and vertically at the top, center, or bottom of the group. This setting currently only applies to the Squarified layout algorithm.
Mixing layouts
By overriding the default layout on a per-variable basis in the Group by pane, it is possible to have different layout algorithms being used at each hierarchy level. This allows to use the optimal rectangular tiling depending on the data at each level, or to create some more creative layouts. Some examples of the latter are provided below:
Layout accuracy
The following algorithms produce exact layouts where the size of the item is exactly proportional (at the pixel level when displayed on the screen and accuracy > 99.999999% when zoomed or exported to vector format) to its corresponding area when comparison are made within a group or if the layout doesn’t have any hierarchy (i.e. no Group by defined).
-
Binary Tree
-
Slice-and-dice
-
Squarified
-
Strip
-
Split
-
Bar
-
Pie
Comparisons can also be made across and with other groups (i.e. everything is comparable) with all the above layouts when Nesting is set to None and Header Placement not set to Surround.
When Nesting is set to Proportional, areas are comparable between items at the same hierarchy level only.
When Nesting is set to Fixed, areas are only comparable within a group. Indeed a small bias is introduced but is in practice negligible.
When Header Placement is set to Surround, areas are only comparable with a group. However, TreeMap attempts to size the label of the surrounding group so that the bias is in practice negligible.
For the Nesting and Header Placement strategies mentioned above, the additional space used around the group is "removed" proportionally of the contained items.
The Pivot by Split Size layout algorithm can potentially introduce errors of ± 2%.
With Circular layouts, only the size of the items at the lowest hierarchy level can be accurately compared, and this can be done across groups. The size of groups cannot be compared as the layout is not space filling.
While the Voronoi algorithm normally produce layouts of a good quality, it relies on some stochastic optimization methods that will therefore only produce an approximation. Inaccuracy of ± 2% should be expected and some items that are too small may be removed from the resulting layout.
Group by
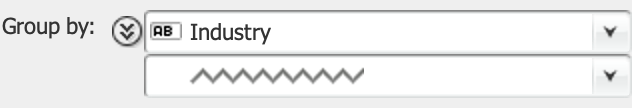
The "Group by" drop-down lists allow aggregating data into multiple levels of hierarchy. By specifying one or more categorical variables, the resulting TreeMap view will be organized into nested areas, giving the possibility to visually assess how big is a group in relation to another one. Therefore, the sequence of variables (from top to bottom) corresponds to groups, sub-groups, sub-sub groups, etc (e.g. Continent, Country, Region, …).
| Only categorical variables and numerical variables with non-unique values can be used for grouping. |
For each variable part of the grouping hierarchy, the full customization possibilities can be specified by using the expand button on the left of the variable drop down list:
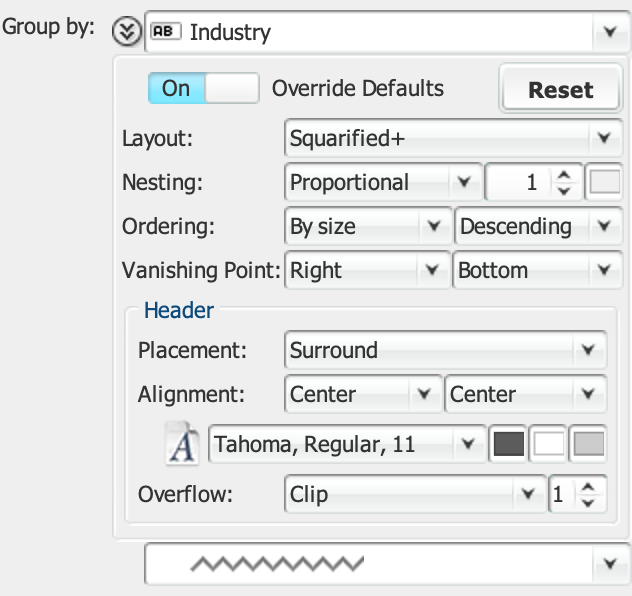
- Override Defaults
-
Common settings can be defined and applied to all the grouping variables that do not override the defaults, or if enabled the settings can be defined on a per group by variable basis.
- Reset
-
Will reset all the settings to their defaults.
- Layout
-
Override the default layout for each group by level. See the Layout section for a description of each layout algorithm and Mixing layouts for some examples.
- Nesting
-
Nesting allows to place gaps around each group of shapes in the resulting treemap view.
- Nesting Color
-
Specify the color of the background of the nested area.
- Ordering
-
This option allows to set the order in which the items should be laid out. Only ordered layouts will fully honor this setting (in particular the Slice-and-dice and Strip layouts).
- Placement
-
Placement allows to control whether labels for enclosing groups should be displayed above or overlaid over the items composing the group. Surround will place a header above each group.
- Horizontal Alignment
-
The label can be horizontally placed at the left, center, or right of the shape.
- Vertical Alignment
-
The label can be vertically placed at the top, center, or bottom of the shape.
- Font
-
Used to specify the font family, style, and size to be used for displaying the label.
- Foreground
-
Specifies the color of the text of the label.
- Effect Color
-
A shadow effect can sometimes help make the text stand out better. If a color is specified here, this enables the effect. The default is Gray, indicating the effect is enabled.
- Header Background
-
Specify the color of the background of the header.
- Overflow
-
If there is not enough room to display the full label and the display can accommodate less than the specified minimum number of characters to display, then the label is omitted. In practice, truncated labels that are too short to allow the viewer to guess its content can clutter up the treemap without adding useful information.
- Min number of characters
-
If there is not enough room to display the full label, and the display can accommodate less than the specified minimum number of characters to display, then the label is omitted. In practice, truncated labels that are too short to allow the viewer to guess its content can clutter up the treemap without adding useful information.
Size
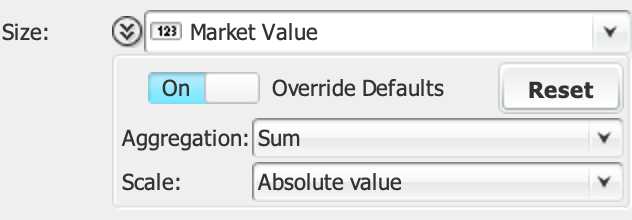
The drop down list tied to the "Size" pane shows the list of numerical variables that can be used to control the size of the shapes. The areas of the shapes will be proportional to the corresponding values, where high values result in a large area, and low values in a small area. Having no variable selected will result in a TreeMap view composed of objects of equal areas.
- Override Defaults
-
Common settings can be defined and applied to all variables that do not override the defaults, or if enabled the settings can be defined on a per variable basis.
- Reset
-
Will reset all the settings to their defaults.
- Aggregation
-
When the data entries are grouped by one or more variable, it may be useful in certain cases to be able to specify the aggregation scheme. While the Sum is certainly the only option that yields an intuitive visualization, other schemes may be useful to perform some more advanced analysis, especially when the Rendering depth has been limited and only aggregate values are being visualized.
This option is only enabled when one or more Group by variable has been selected. - Scale
-
By default, TreeMap uses the Absolute Value if the variable contains negative numbers. Choose Original to have negative values removed from the display, Inverse to have high values correspond to small shapes and small values correspond to large shapes, or another logarithmic scale if only the order of magnitude is of interest.
Color
The Color drop down list gives the possibility of selecting which variable should be used for coloring the shapes. It also include a drop-down menu for doing the following:
- Import Colormap…
-
Import a colormap definition and apply it to the currently selected color variable.
- Export Colormap…
-
Export the colormap definition of the currently selected color variable.
- Copy Graphics
-
Copy the colormap to the clipboard.
- Export Graphics…
-
Export the colormap to a raster or vector-based graphic format.
- Print…
-
Print the colormap.
Categorical colormap
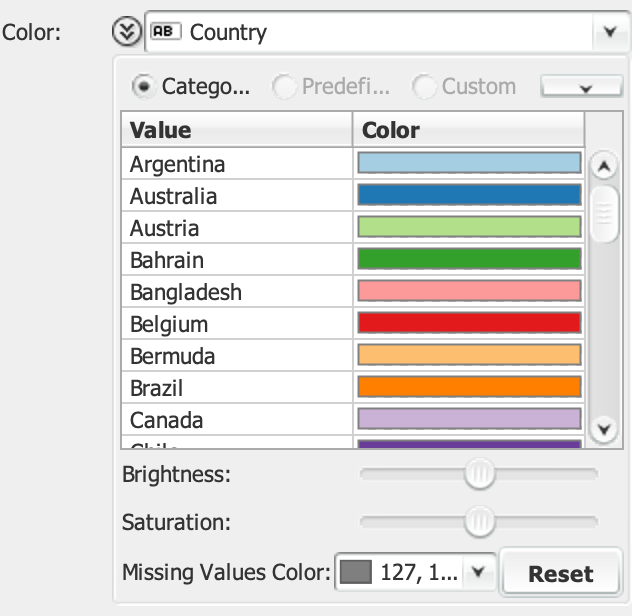
If a categorical variable is selected, then colors are automatically assigned to each of the value. Each color can be individually customized by clicking on the color itself. Each color can be individually changed by clicking on the color cell.
- Missing Value Color
-
If the data contains missing values, then their color can be edited here.
- Reset
-
Allows to reassign all the values to their default color.
Predefined colormap
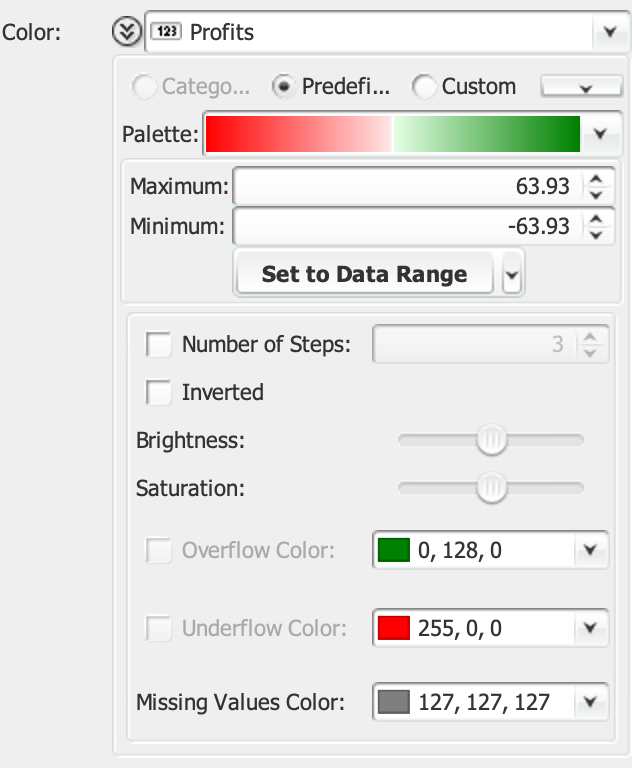
If a numerical variable is selected, TreeMap offers the possibility of setting the lowest and highest values that should be mapped to the selected colormap. If the variable contains negative values, the range is automatically made symmetric.
- Palette
-
A color palette can be selected from a wide range of predefined color palettes
- Maximum
-
Sets the upper bound of the colormap.
- Minimum
-
Sets the lower bound of the colormap.
- Set to Data Range
-
Set the minimum and maximum of the colormap to the minimum and maximum values of the data.
- Set to Symmetrical Range around 0
-
Will make the colormap symmetrical should it contain negative values.
- Set to Rounded Range
-
Will round the minimum and maximum values to their next power of 10 value.
- Number of Steps
-
Can be used to segment the palette into a specified number of discrete colors.
- Inverted
-
Invert the colormap.
- Brightness
-
The color luminance can be adjusted by increasing or decreasing its brightness.
- Saturation
-
The color intensity can be adjusted by increasing or decreasing its saturation.
- Overflow Color
-
If some of the data values fall above the upper threshold, then their color can be edited here.
- Underflow Color
-
If some of the data values fall below the lower threshold, then their color can be edited here.
- Missing Value Color
-
If the data contains missing values, then their color can be edited here.
Custom colormap
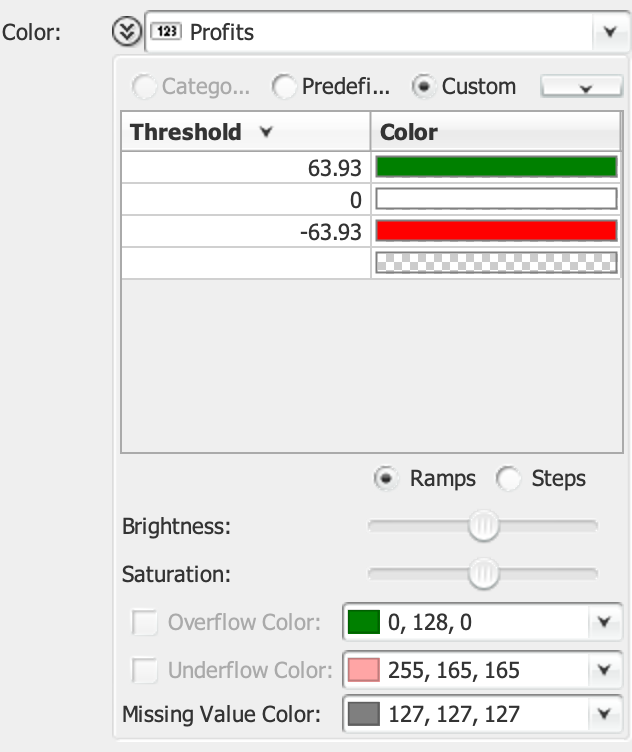
For more customization possibilities, it is also possible to define a custom colormap by setting thresholds at given values. TreeMap will take care of interpolating the colors if Ramps mode is selected, or will make them valid for the whole range in Steps mode.
- Threshold
-
Define the threshold for which values equal or above its value will be assigned the associated color. Removing a threshold can be accomplished by setting its color to None. New thresholds can be added by specifying a value in the last entry of the table. The color associated to the new threshold will be automatically extrapolated from the current colormap definition.
- Color
-
The color associated with each threshold.
- Ramps/Steps
-
Indicates whether the values should be interpolated within the threshold ranges (Ramps) or made discrete (Steps).
- Brightness
-
The color luminance can be adjusted by increasing or decreasing its brightness.
- Saturation
-
The color intensity can be adjusted by increasing or decreasing its saturation.
- Overflow Color
-
If some of the data values fall above the upper threshold, then their color can be edited here.
- Underflow Color
-
If some of the data values fall below the lower threshold, then their color can be edited here.
- Missing Value Color
-
If the data contains missing values, then their color can be edited here.
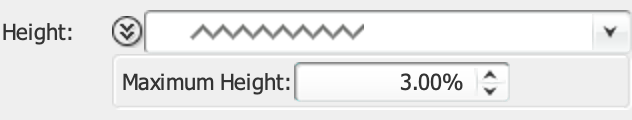
Height
Allows to control the variable that is used for the 3rd dimension, i.e. to have the shapes elevated above the ground plane proportional to their value.
| Setting the height is only possible if a layout using rectangular shapes is being used. Otherwise, it is disabled. |
- Maximum Height
-
Defines the maximum height as a proportion of the treemap view dimension.
Labels
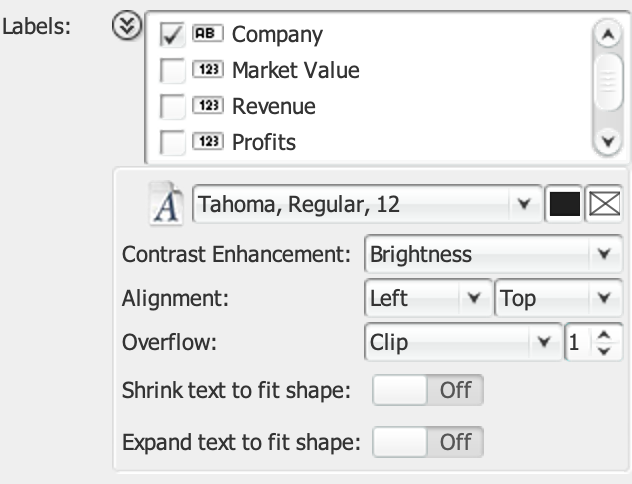
The Labels list allows to select which variable should be displayed inside each shape. Multiple labels can be specified and will be displayed line-by-line, and their appearance can be customized individually. The labels will be cut or not displayed at all should the area be too small. Zooming in or drilling down will make them appear. Both categorical and numerical variables can be used for labeling.
Variables can be ticked for their inclusion in the list of variables to be displayed. When no variable is selected, then the settings are applied to all the variables that do not override the defaults. Selecting one individual variable from the list allow to define how it should displayed. Unselecting the currently chosen variable can be done using the Ctrl key.
- Override Defaults
-
Common settings can be defined and applied to all variables that do not override the defaults, or if enabled the settings can be defined on a per variable basis.
- Reset
-
Will reset all the settings to their defaults.
- Font
-
Used to specify the font family, style, and size to be used for displaying the label.
- Foreground
-
Specifies the color of the text of the label. This color can be automatically adapted to improve readability depending on the background color using Contrast Enhancement.
- Effect Color
-
A glow effect can sometimes help make the text stand out better. If a color is specified here, this enables the effect. The default is None, indicating the effect is disabled.
- Contrast Enhancement
-
An automatic contrast enhancement scheme can be used to modify the color specified under Foreground so that the color of the text is automatically changed when contrast with the background color is two low and the text therefore unreadable.
- Horizontal Alignment
-
The label can be horizontally placed at the left, center, or right of the shape.
- Vertical Alignment
-
The label can be vertically placed at the top, center, or bottom of the shape.
- Min number of characters
-
If there is not enough room to display the full label and the display can accommodate less than the specified minimum number of characters to display, then the label is omitted. In practice, truncated labels that are too short to allow the viewer to guess its content can clutter up the treemap without adding useful information.
- Overflow
-
Controls what to do if there is not enough room to display the label entirely. Possible options are Truncate (… is added at the end of label), Clip (the text is just cut), or WordWrap (the text will flow to the next line).
- Shrink text to fit shape
-
The font size will be dynamically adjusted so that the text fills the entire width of the shape. The font size specified in Font serves as the maximum font size.
- Expand text to fit shape
-
The font size will be dynamically adjusted so that the text fills the entire width of the shape. The font size specified in Font serves as the minimum font size.
Tooltip
Details on demand through pop-ups can be defined by selecting the variables that should compose the tooltip and by customizing their appearance.
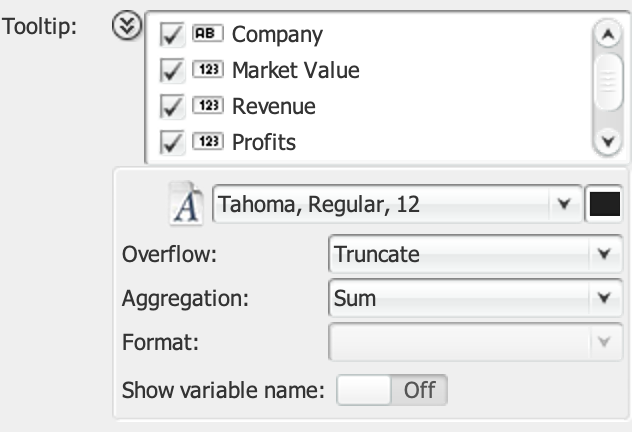
Variables can be ticked for their inclusion in the list of variables to be displayed in the tooltip. When no variable is selected, then the settings are applied to all the variables that do not override the defaults. Selecting one individual variable from the list allow to define how it should displayed. Unselecting the currently chosen variable can be done using the Ctrl key.
- Override Defaults
-
Common settings can be defined and applied to all variables that do not override the defaults, or if enabled the settings can be defined on a per variable basis.
- Reset
-
Will reset all the settings to their defaults.
- Font
-
Used to specify the font family, style, and size to be used for displaying the entry in the tooltip.
- Foreground
-
Specifies the color of the text of the entry in the tooltip.
- Overflow
-
Controls what to do if there is not enough room to display the tooltip entry entirely. Possible options are Truncate (… is added at the end of tooltip entry), Clip (the text is just cut), or WordWrap (the text will flow to the next line).
- Aggregation
-
See Aggregation in the Size section.
- Format
-
Controls how numerical and date variables should be formatted. See the chapter about how to configure the Variables for a full description of the formatting patterns.
- Show variable name
-
If checked, will display the variable name on the right side of the value.
Rendering
More options can be customized in the Rendering pane. Maps can be rendered Flat, or with a pseudo-3D shaded Cushion look that highlights the hierarchical structure.
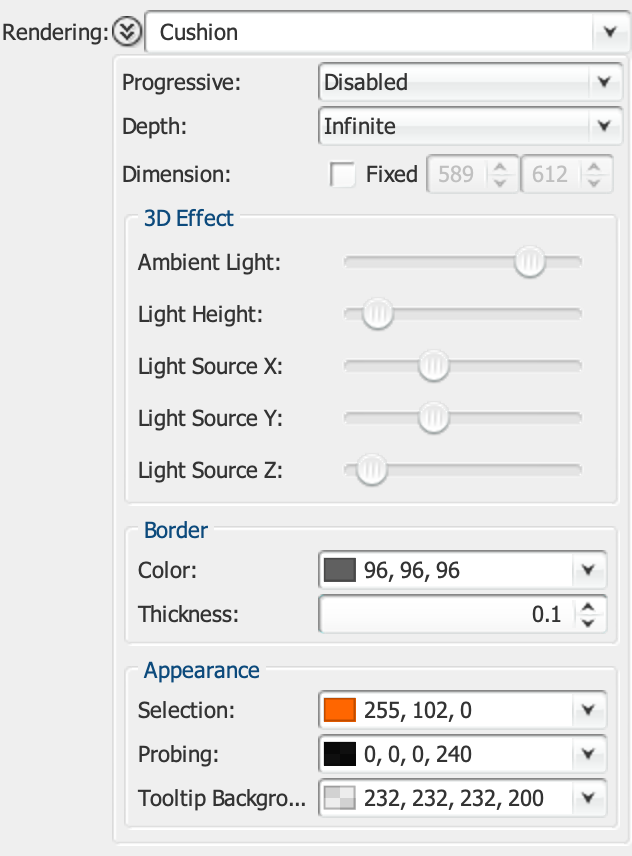
- Progressive
-
Disabled by default, this option allows to enable the incremental rendering of the treemap. This can be particularly useful for large datasets or layouts with complex rendering options where the standard interaction speed is not fast enough.
- Depth
-
The depth allows to set how many hierarchy levels should be displayed, allowing to hide the details of sub-elements.
- Dimension
-
The dimension of the treemap view can be made fixed, typically in the context of visualization made for print or for creating treemaps larger than the actual screen.
- Ambient Light
- Light Height
- Light Source X
- Light Source Y
- Light Source Z
-
Allow to parametrize the light source location and intensity used by the Cushion rendering mode.
- Color
-
Specify the color to use for the borders around shapes
- Thickness
-
Specify the thickness of the border
- Selection
-
Define the color to use for selection
- Probing
-
Define the color to use for probing
- Tooltip Background
-
Define the color of the background of the tooltip.
- Hide Filtered
-
If checked, this makes the filtered items be removed from the layout. If unchecked, filtered items will simply not be made visible using their assigned color, but their shape will still be part of the layout.
- Hide Searched
-
If checked, this makes the items not matching the search criteria be removed from the layout. If unchecked, non-matching items will simply not be made visible using their assigned color, but their shape will still be part of the layout.
Legend
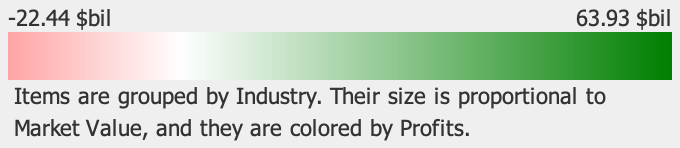
A graphical depiction of the color scale as well as a textual description of the main options that have been selected. A context menu (reachable by right clicking the mouse) provides means of configuring the legend as well exporting its view:
- Range
-
Select whether the minimum and maximum values of the legend should be the minimum and maximum values found in the data, or the configured range of the colormap.
- Copy Graphics
-
Copy the legend to the clipboard.
- Export Graphics…
-
Export the legend to a raster or vector-based graphic format.
- Print…
-
Print the legend.
TreeMap view
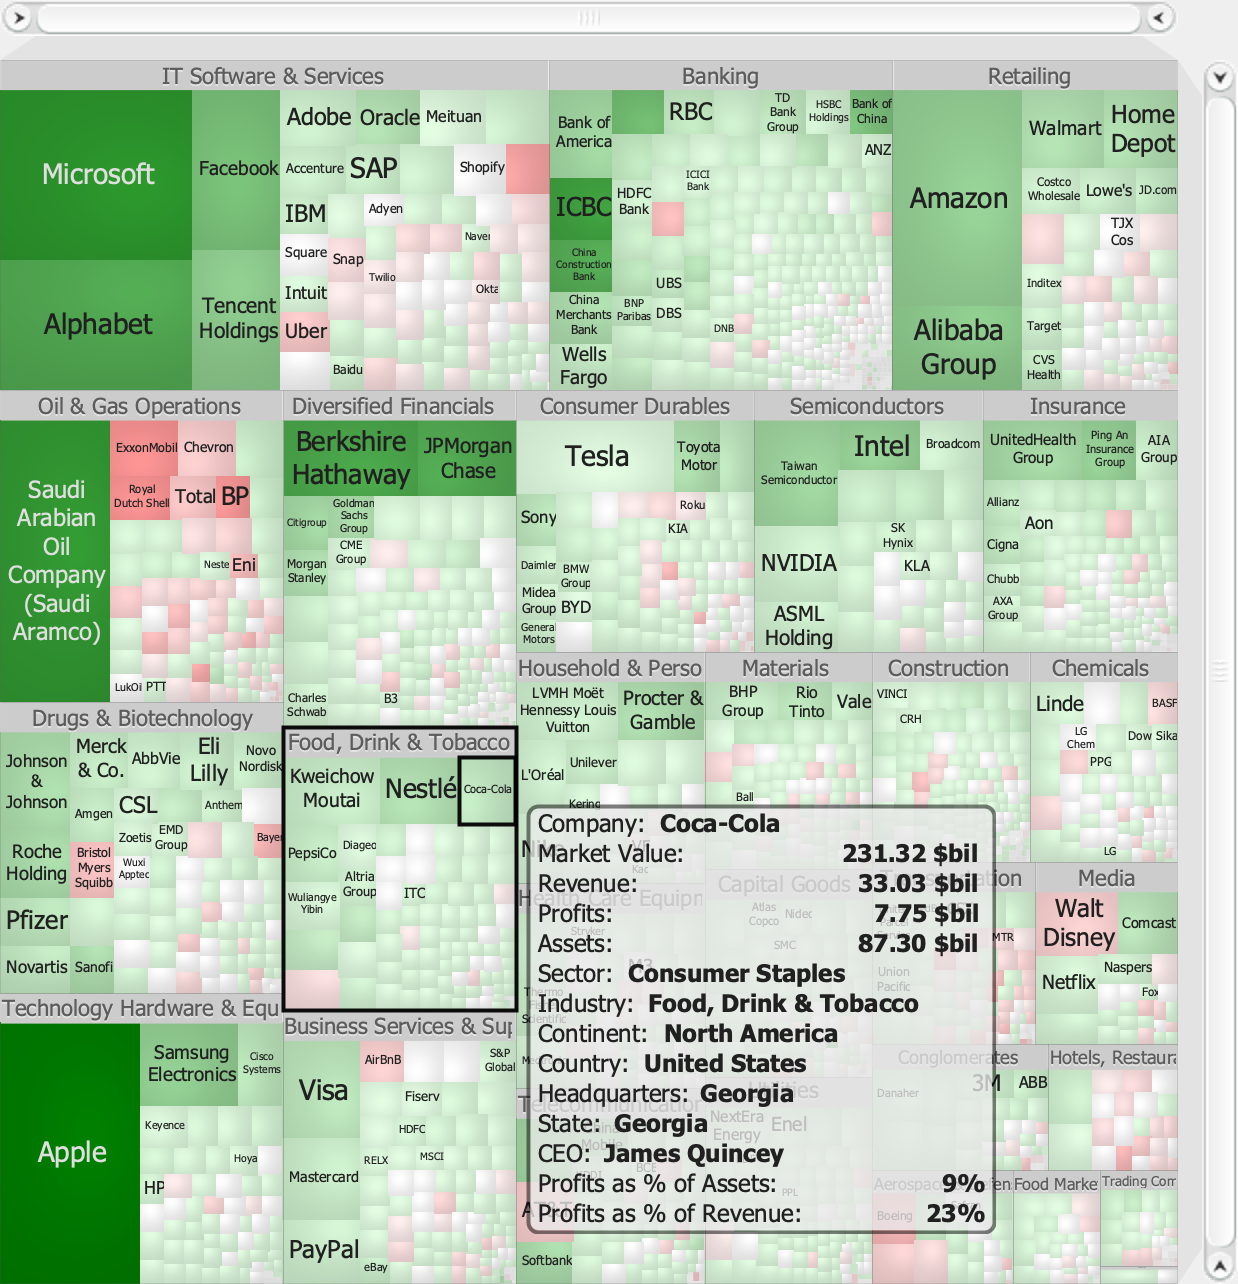
On the right side of the user interface, you will find the TreeMap view that corresponds to the chosen settings in the Configuration panel. Each item is represented by a colored shape. They will always attempt to fill the available space in an optimal way.
Moving the mouse over a shape will display a pop-up window (also called a tooltip) that shows the values configured in the "Labels" section of the "Configuration" panel.
Zooming
You can zoom into the treemap by using the range sliders on the top and to the right of the display area. You can zoom out by double-clicking anywhere on the slider.
Zooming in can also be achieved by using the keyboard and pressing the Page Down key. Correspondingly, zoom out using the Page Up key. And of course the mouse wheel also works.
Drilling
Drilling down into a node of the tree can be done by double-clicking on a shape (or pressing the Down key on the keyboard). When you have reached the bottom of the hierarchy, further drilling will result in going back up to the root (alternatively by pressing the Up key).
Probing and selection
Selection can be performed by clicking on a shape. Adding to or removing items from the selection can be done by holding the Ctrl key down while clicking on shapes.
Multiple adjoining items can be selected using a rubberband which is activated by dragging the mouse while holding down the Alt key.
TreePlot view
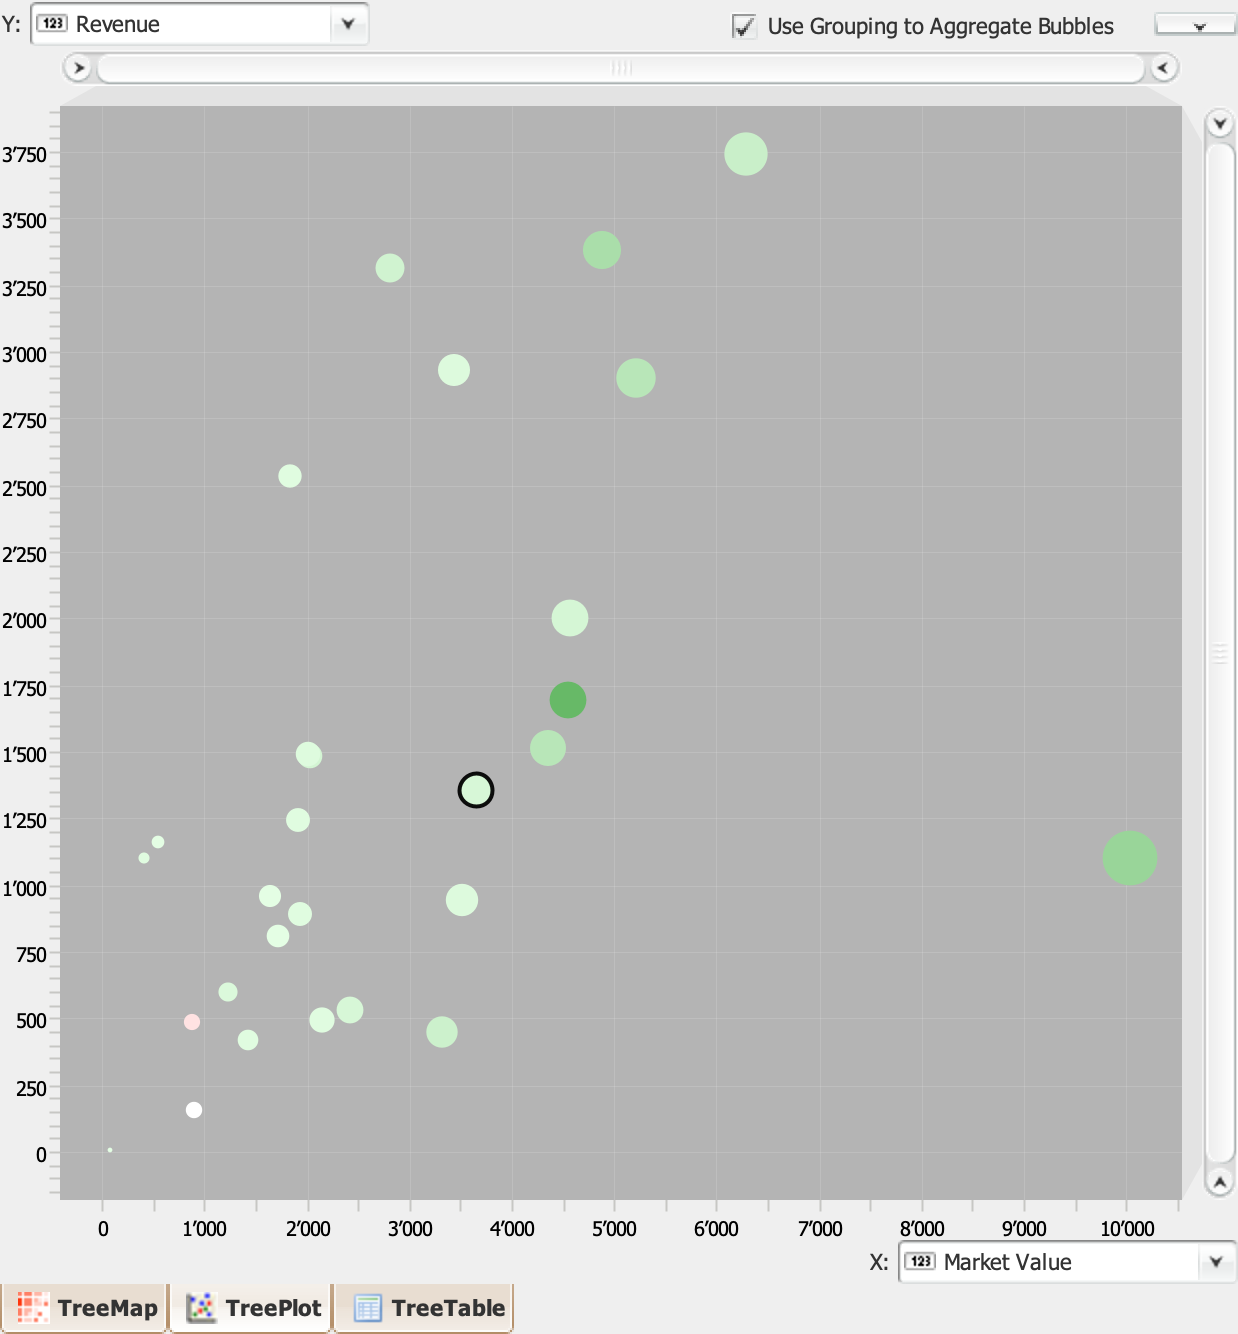
The TreePlot view allows you to create a scatter plot of the data. Any combination of numerical variables can be used to map to the x- and y-axes as well as size and color of the glyphs.
Configuration
To configure which of the numerical variables should be mapped to the x- and y-axes, use the drop-down lists located at the end of the axes.
The color and size of the markers are determined the same way as for the TreeMap view, i.e. the definitions in the drop-down lists in the Configuration panel.
- Use Grouping to Aggregate Bubbles
-
When active, the items displayed in the TreePlot are the aggregate values according to the hierarchy defined under "Group by". Otherwise, the items at the lowest level of the hierarchy (i.e. the leaf nodes) are displayed.
Zooming
You can zoom in by using the range sliders on the top and to the right of the display area. You can zoom out by double-clicking anywhere on the slider.
And of course the mouse wheel also works.
Drilling
Drilling down into a node of the tree can be done when the "Use Grouping to Aggregate Bubbles" option is active by double-clicking on a bubble (or pressing the Down key on the keyboard). When you have reached the bottom of the hierarchy, further drilling will result in going back up to the root (alternatively by pressing the Up key).
Probing and selection
Selection can be performed by clicking on a marker. Adding to or removing items from the selection can be done by holding the Ctrl key down while clicking on markers.
Multiple adjoining items can be selected using a rubberband which is activated by dragging the mouse while holding down the Alt key.
TreeTable view
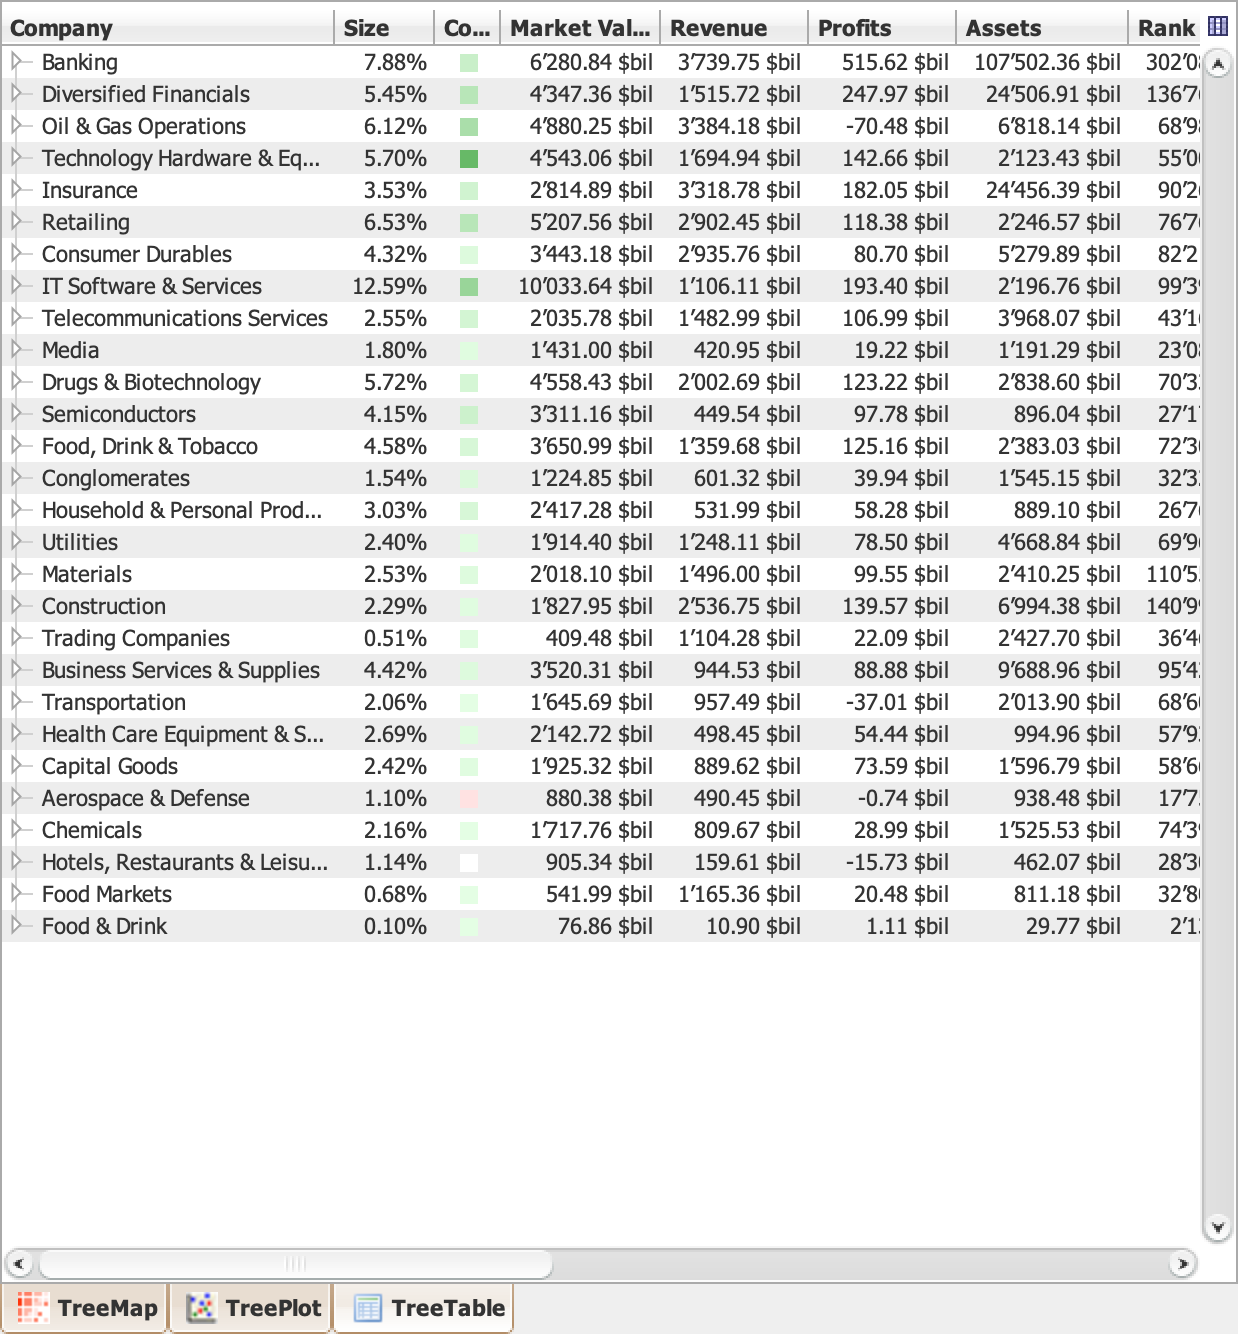
The TreeTable view is pretty straightforward. It simply shows all the active (not filtered out) objects in a traditional table format.
If one or more variables are currently used for grouping, then the rows will be appropriately organized in a hierarchical manner, corresponding to the grouping chosen.
Sorting
Clicking on table column header will sort the column: the first click will sort ascending; the second click descending; the third click will reset the data to the original order.
To sort on multiple columns, just press the Ctrl key and hold it down while clicking on the other columns. A number is displayed in the header to indicate the rank amongst the sorted columns.
Probing and selection
Selected rows in the TreeTable view will be displayed in the TreeMap view accordingly.
Filter on a subset

If you would like to work with or highlight only a subset of the data, then you can use both the search function and the filters provided in the Filters panel.
You can use the "Hide filtered" and the "Hide searched" check boxes to define whether objects that do not meet the criteria should be removed from the display or simply greyed-out. Reset will bring back the search and filters to their default configuration.
Search
The search function will look at every value and see whether it matches the given criteria. How the search is performed can be customized by using the drop-down list at the beginning of the field.
Filter
Categorical filter
For categorical variables, drop-down lists are provided. They allow to select which values should be visible. Multiple selection can be made by holding down the Ctrl key while selecting individual entries. Ctrl+A can be used to select all entries. The Reset button will restore the given filter to its initial state
Numerical filter
For numerical variables, range sliders are provided that allow to define a given range that the value should be in. Click on the left or right end of the range slider, and drag it up or down to define the filter range.
| Double-click on a range silder to reset it to its full range position. |
See details

The Details panel provides the possibility of seeing the actual values of the currently probed item. While probing, the value of each variable is displayed in the Value column.
Configure variables
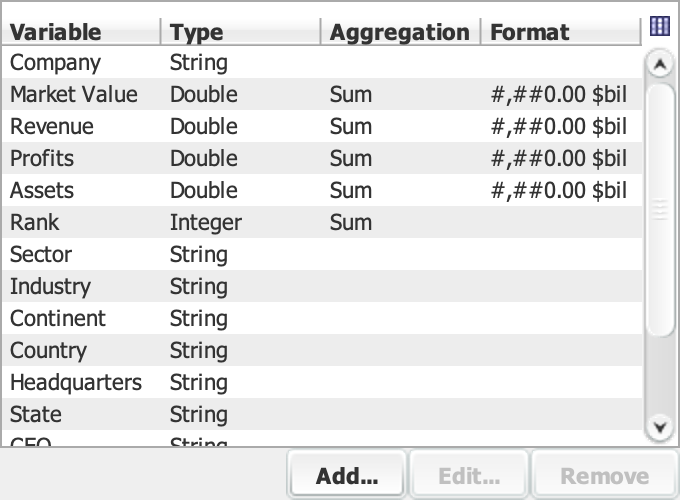
The Variables panel allows the customization of each of the available variables. It is possible to define how numerical and date variables should be formatted. Common formatting patterns include "0%" to display percentages, "$ ,#" to display currency amount and "0.00 hours" for timing information. See the section about Formatting patterns for a full description of the formatting patterns.
Finally, one has the possibility of adding derived variables. To do so, click on "Add…" at the bottom of the panel, give a name to the variable to be created, and enter an expression to define how it should be computed. Use for example "[Budget] / [Current]" to compute the ratio between the Budget variable and the Current variable. See the section about Expression language and functions for a full description of the language.
Formatting patterns
Decimal formats
You can customize the display of numbers, and TreeMap allows you to control the display of leading and trailing zeros, prefixes and suffixes, grouping (thousands) separators, and the decimal separator.
Constructing Patterns
You specify the formatting properties of numbers with a pattern. The pattern determines what the formatted number looks like. For a full description of the pattern syntax, see Number Format Pattern Syntax.
The example that follows creates a formatter by passing a pattern
value |
pattern |
output |
Explanation |
|---|---|---|---|
|
123456.789 |
,.# |
123,456.789 |
The pound sign (#) denotes a digit, the comma is a placeholder for the grouping separator, and the period is a placeholder for the decimal separator. |
|
123456.789 |
#. |
123456.79 |
The |
|
123.78 |
000000.000 |
000123.780 |
The |
|
12345.67 |
$,.# |
$12,345.67 |
The first character in the |
|
12345.67 |
\u00A5,.# |
¥12,345.67 |
The |
Number Format Pattern Syntax
You can design your own format patterns for numbers by following the rules specified by the following BNF diagram:
pattern := subpattern{;subpattern} subpattern := {prefix}integer{.fraction}{suffix}
prefix := '\\u0000'..'\\uFFFD' - specialCharacters suffix := '\\u0000'..'\\uFFFD' -
specialCharacters integer := '#'* '0'* '0' fraction := '0'* '#'*
The notation used in the preceding diagram is explained in the following table:
|
Notation |
Description |
|
|
0 or more instances of X |
|
`(X |
Y)` |
|
either X or Y |
|
|
any character from X up to Y, inclusive |
|
|
characters in S, except those in T |
|
In the preceding BNF diagram, the first subpattern specifies the format for positive numbers. The second subpattern, which is optional, specifies the format for negative numbers.
Although not noted in the BNF diagram, a comma may appear within the integer portion.
Within the subpatterns, you specify formatting with special symbols. These symbols are described in the following table:
| Symbol | Description |
|---|---|
|
0 |
a digit |
|
# |
a digit, zero shows as absent |
|
. |
placeholder for decimal separator |
|
, |
placeholder for grouping separator |
|
E |
separates mantissa and exponent for exponential formats |
|
; |
separates formats |
|
- |
default negative prefix |
|
% |
multiply by 100 and show as percentage |
|
‰ |
multiply by 1000 and show as per mille |
|
¤ |
currency sign; replaced by currency symbol; if doubled, replaced by international currency symbol; if present in a pattern, the monetary decimal separator is used instead of the decimal separator |
|
X |
any other characters can be used in the prefix or suffix |
|
' |
used to quote special characters in a prefix or suffix |
Date formats
The contents of the pattern determines the format of the date and time. For a full description of the pattern’s syntax, see the tables in Date Format Pattern Syntax.
The following table shows the output generated for some example patterns:
|
Pattern |
Output |
|
dd.MM.yy |
30.06.09 |
|
yyyy.MM.dd G 'at' hh:mm:ss z |
2009.06.30 AD at 08:29:36 PDT |
|
EEE, MMM d, ''yy |
Tue, Jun 30, '09 |
|
h:mm a |
8:29 PM |
|
H:mm |
8:29 |
|
H:mm:ss:SSS |
8:28:36:249 |
|
K:mm a,z |
8:29 AM,PDT |
|
yyyy.MMMMM.dd GGG hh:mm aaa |
2009.June.30 AD 08:29 AM |
Date Format Pattern Syntax
You can design your own format patterns for dates and times from the list of symbols in the following table:
|
Symbol |
Meaning |
Presentation |
Example |
|
G |
era designator |
Text |
AD |
|
y |
year |
Number |
2009 |
|
M |
month in year |
Text & Number |
July & 07 |
|
d |
day in month |
Number |
10 |
|
h |
hour in am/pm (1-12) |
Number |
12 |
|
H |
hour in day (0-23) |
Number |
0 |
|
m |
minute in hour |
Number |
30 |
|
s |
second in minute |
Number |
55 |
|
S |
millisecond |
Number |
978 |
|
E |
day in week |
Text |
Tuesday |
|
D |
day in year |
Number |
189 |
|
F |
day of week in month |
Number |
2 (2nd Wed in July) |
|
w |
week in year |
Number |
27 |
|
W |
week in month |
Number |
2 |
|
a |
am/pm marker |
Text |
PM |
|
k |
hour in day (1-24) |
Number |
24 |
|
K |
hour in am/pm (0-11) |
Number |
0 |
|
z |
time zone |
Text |
Pacific Standard Time |
|
' |
escape for text |
Delimiter |
(none) |
|
' |
single quote |
Literal |
' |
Characters that are not letters are treated as quoted text. That is, they will appear in the formatted text even if they are not enclosed within single quotes.
The number of symbol letters you specify also determines the format. For example, if the "zz" pattern results in "PDT," then the "zzzz" pattern generates "Pacific Daylight Time." The following table summarizes these rules:
| Presentation | Number of Symbols | Result |
|---|---|---|
|
Text |
1 - 3 |
abbreviated form, if one exists |
|
Text |
>= 4 |
full form |
|
Number |
minimum number of digits is required |
shorter numbers are padded with zeros (for a year, if the count of 'y' is 2, then the year is truncated to 2 digits) |
|
Text & Number |
1 - 2 |
number form |
|
Text & Number |
3 |
text form |
Expression language and functions
The language is based on a subset of SQL, the standard language for database queries. Below is the reference for the language, including literal types, data field references, basic operators, and included functions.
Literal Values and Data Field References
The fundamental building blocks of the expression language, representing data values.
-
Boolean literals (
TRUE, FALSE) -
The boolean literals representing true and false conditions, parsed to type
boolean -
Integer literals (
1, -5, 12340) -
Undecorated, non-decimal numbers are parsed as numbers of type
int -
Long literals (
1L, -5L, 12340L) -
Integer values decorated with the suffix "L" are parsed as numbers of type
long -
Double literals (
1.0, 3.1415, 1e-35, 2.3e6) -
Numbers with decimals or exponents in scientific notation are parsed as numbers of type
double -
Float literals (
1.0f, 3.1415f, 1e-35f, 2.3e6f) -
Floating-point values decorated with the suffix "f" are parsed as numbers of type
float -
String literals (
"some text", 'a label') -
Text strings placed in double (") or single (') quotations are parsed as
Stringliterals -
Null literal (
null) -
The string
nullis parsed as an ObjectLiteral of type null. -
Data field references (
_strokeColor, [a data field]) -
Free-standing strings or those placed within brackets are parsed as a reference to the data field of that name. Brackets are required for any fields that include spaces or other unusual characters in their name (e.g., characters like +, -, *, etc), or conflict with an existing keyword For example,
trueparses to a boolean literal while[true]parses to a reference to a data field named 'true'.
Operators and Control Flow
Basic operators and control flow structures for the expression language.
-
x + y(addition) -
Add
xandy -
x - y(subtraction) -
Subtract
yfromx -
x * y(multiplication) -
Multiply
xandy -
x / y(division) -
Divide
xbyy -
x ^ y(exponentiation, pow) -
Raise
xto the exponenty -
x % y(modulo) -
Return the remainder of
xdivded byy -
x = y, x == y(equality) -
Indicates if
xandyare equal -
x != y, x <> y(inequality) -
Indicates if
xandyare not equal -
x > y(greater than) -
Indicates if
xis greater thany -
x >= y(greater than or equal to) -
Indicates if
xis greater than or equal toy -
x < y(less than) -
Indicates if
xis less thany -
x ⇐ y(less than or equal to) -
Indicates if
xis less than or equal toy -
x AND y, x && y(and) -
Indicates if both
xandyare true -
x OR y, x || y(or) -
Indicates if either
xoryis true -
NOT x, !x(not) -
Indicates if the negation of
xis true -
x XOR y(exclusive or) -
Indicates if one, but not both, of
xoryis true -
IF test THEN x ELSE y(if-then-else) -
Evaluates the predicate
test, and if true evaluates and returns the expression`x`, and if false evaluates and returns the expressiony -
()(parentheses) -
Groups expressions together to enfore a particular order of evaluation. For example,
1+2*3evaluates to7, while(1+2)*3valuates to9.
Mathematical Functions
Functions for performing mathematical calculations.
-
ABS(x) -
Returns the absolute value of
x -
ACOS(x) -
Returns the inverse cosine (arc cosine) of a
x -
ASIN(x) -
Returns the inverse sine (arc sine) of a
x -
ATAN(x) -
Returns the inverse tangent (arc tangent) of a
x -
ATAN2(y, x) -
For the Cartesian coordinates`x`,
yeturn the polar coordinate angle theta -
CEIL(x), CEILING(x) -
Returns the nearest integer value greater than or equal to
x. -
COS(x) -
Returns the cosine of
x -
COT(x) -
Returns the cotangent of
x -
DEGREES(x) -
Converts
xfrom radians to degrees -
EXP(x) -
Returns the value of (the base of natural logarithms) raised to the
xpower -
FLOOR(x) -
Returns the nearest integer value less than or equal to
x. -
LOG(x), LOG(b, x) -
With one argument, returns the natural logarithm (logarithm base e) of
xWith two arguments, returns the logarithm ofxfor the provided baseb -
LOG2(x) -
Returns the logarithm base 2 of
x -
LOG10(x) -
Returns the logarithm base 10 of
x -
MAX(a, b, c, …) -
Returns the maximum value among the provided arguments
-
MIN(a, b, c, …) -
Returns the minimum value among the provided arguments
-
MOD(x, y) -
Returns
xmoduloythe remainder ofxdivided byy) -
PI() -
Returns the constant π (= 3.1415926535…), the ratio between the circumference and diameter of a circle
-
POW(x, y), POWER(x, y) -
Return the value of
xraised to the exponenty -
RADIANS(x) -
Converts
xfrom degrees to radians -
RAND() -
Returns a random floating-point value between 0 and 1
-
ROUND(x) -
Returns the value of
xrounded to the nearest integer -
SIGN(x) -
Returns the sign of
x: 1 for positive, -1 for negative -
SIN(x) -
Returns the sine of
x -
SQRT(x) -
Returns the square root of
x -
SUM(a, b, c, …) -
Returns the sum of the provided input value
-
TAN(x) -
Returns the tangent of
x -
SAFELOG10(x) -
Returns a "negative safe" logarithm base 10 of`x`, equivalent to
SIGN(x) * LOG10(ABS(x)) -
SAFESQRT(x) -
Returns a "negative safe" square root of`x`, equivalent to
SIGN(x) * SQRT(ABS(x))
String Functions
Functions for processing text strings.
-
CAP(str) -
Capitalize words in the string`str`. Individual words/names will be given uppercase first letters, with all other letters in lowercase.
-
CONCAT(a, b, c, …) -
Concatenate the input strings into one resulting string.
-
CONCAT_WS(sep, a, b, c, …) -
Concatenate with separator. Concatenates the input strings into one resulting string, placing the string
sepbetween each of the other arguments -
FORMAT(x, d) -
Format the number
xas a string of the type ",.", showingddecimal places -
INSERT(str, pos, len, newstr) -
Replaces the substring of length
lenstarting at positionposin input stringstrwith the stringnewstr -
LEFT(str, len) -
Returns the leftmost
lencharacters of stringstr -
LENGTH(str) -
Returns the length, in characters, of the input string
str -
LOWER(str), LCASE(str) -
Returns the string
strmapped to lowercase letters -
LPAD(str, len, pad) -
Pad the left side of string
strwith copies of string`pad`, up to a total padding oflencharacters -
MID(str, pos, len) -
Return a substring of
strof lengthlen, starting at positionpos -
POSITION(substr, str) -
Returns the starting position of the first occurrence of substring
substrin the string`str`. Returns -1 if the substring is not found. -
REVERSE(str) -
Returns a reversed copy of the input string
str -
REPEAT(str, count) -
Returns a string consisting of
strrepeatedcounttimes -
REPLACE(str, orig, replace) -
Returns a copy of
strin which all occurrences oforighave been replaced byreplace -
RIGHT(str, len) -
Returns the
lenrightmost characters of stringstr -
RPAD(x) -
Pad the right side of string
strwith copies of string`pad`, up to a total padding oflencharacters -
SPACE(n) -
Returns a string consisting of
nwhitespace characters -
SUBSTRING(str,pos), SUBSTRING(str,pos,len) -
For two arguments, returns the substring of
strstarting at positionposand continuing to the end of the string. For three arguments, returns the substring ofstrof length`len`, beginning at positionpos -
UPPER(str), UCASE(str) -
Returns the string
strmapped to uppercase letters
Saving settings, data, and graphics
TreeMap can save the data along with the settings applied to the visualization in its own data format (file with .mtm extension). For this, use the or menu entries. To only save the settings and have the data file referenced instead of being embedded, you can produce such a file by doing:
-
Open a data file (Excel for example)
-
Modify all the parameters as desired
-
Do
-
Select
Macrofocus TreeMap (*.mtm)as file type
When you open the resulting file (e.g. using ), it will read all the data from the referenced data file and apply all the settings. You can also see how the settings are stored in the resulting .mtm file. It can be opened using any text editor.
Exporting graphics
You can also export the currently active TreeMap, TreePlot, or TreeTable view using the following schemes:
-
Using : the current view is exported in vector or raster form in one of the following supported formats:
-
PDF (Portable Document Format) (
*.pdf) -
The resulting document is ideal for printing or inclusion in a report. It is a vector format and therefore resolution independent.
-
Scalable Vector Graphics (
*.svg) -
The resulting document is ideal for further editing and for inclusion into another document. It is a vector format and therefore resolution independent. Scalable Vector Graphics (SVG) can be displayed by many web browsers with an embedded SVG viewer, or edited by any application supporting SVG (such as Adobe Illustrator).
-
Postscript (
*.ps) -
A common vector format and therefore resolution independent. Can be used for printing.
-
EMF (Enhanced Metafile) (
*.emf) -
A resolution independent format common on the Windows platform.
-
PNG (Portable Network Graphics) (
*.png) -
A raster format.
-
JPEG (
*.jpg) -
A raster format.
-
Compuserve GIF (
*.gif) -
A raster format.
-
TIFF (Tagged Image File Format) (
*.tiff) -
A raster format.
All the raster export format allow for setting the desired DPI for high-quality output.
-
PDF (Portable Document Format) (
-
Using : the current view is put into the clipboard in bitmap format (and can be pasted into applications such as Microsoft Powerpoint).
Exporting data
The data visible in the TreeTable view can be exported with for further processing in spreadsheet programs or other applications. The following formats are supported:
-
CSV (Commad Delimited) (
*.csv) -
The comma-separated values (CSV) format stores tabular data (numbers and text) in plain-text form. Most spreadsheet and data management software are able to import data in this format.
-
Text (Tab Delimited) (
*.txt;*.tsv;*.tab;*.raw) -
The tab-separated values format is a popular method of data interchange among databases and spreadsheets. It stores tabular data (numbers and text) in plain-text form.
-
Microsoft Excel Workbook (
*.xls;*.xlsx;*.xlsm) -
The comma-separated values (CSV) format stores tabular data (numbers and text) in plain-text form. Most spreadsheet and data management software are able to import data in this format.
-
Apache Arrow (
*.arrow) -
The Arrow format stores tabular data (numbers and text) in form that allow data access without serialization overhead.
-
Apache Parquet (
*.parquet) -
The Parquet format stores tabular data (numbers and text) in a compressed, efficient columnar data representation. It is popular in the Hadoop ecosystem.
Exporting 3D model
It is possible to export a 3D model of the treemap using the following scheme:
-
Using : the current treemap is exported in form of a 3D model in one of the following supported formats:
-
X3D (
*.x3d) -
The resulting document is ideal for 3D printing. It is compatible with Blender.
-
VRML (
*.vrl) -
The resulting document is ideal import into general purpose 3D editing software and further editing.
-
X3DOM (
*.html) -
Can be used for online previewing through any modern web browser.
-
X3D (
Import/export of settings
All the settings can be exported using to be applied to another dataset using
Printing
Using : to get a printout of the treemap view (note that the resulting print job can also be redirected to a file)
Invoking TreeMap through the command line
TreeMap can be invoked from the command line, typically for automating and batch processing the production of several treemaps.
If you intend to use this scripting possibility in unattended and automated batch jobs (typically a night job running on a remote build server): non-human devices that utilize our software without user interaction are counted as users and you would then need to order the appropriate number of licenses.
TreeMap comes bundled with its own optimized Java runtime (that can be found in the jre directory), which is order of magnitude faster for certain operations (in particular for all word-wrap operations) than the standard Java runtime. Nevertheless, TreeMap is fully compatible with Java 11. The invocation of TreeMap from the command line can be done as follows:
- Windows
-
Start Command Prompt application and then type:
cd "C:\Program Files\TreeMap"
jre\bin\java -jar lib/treemap-swing.jar --out output.png data.mtm`- macOS
-
Start Terminal application
cd /Applications/TreeMap/
./.install4j/jre.bundle/Contents/Home/bin/java -jar lib/treemap-swing.jar --out output.svg data.xls- Linux
cd /usr/local/TreeMap
jre/bin/java -jar lib/treemap-swing.jar --out output.ps data.csv
A typical usage scenario is to have some settings applied the data. To proceed, create a settings file ( with the .mtms file extension) that then be loaded together with the data by specifying it with the --settings option .
To be able to produce treemaps of arbitrary sizes, tick “Fixed” in pane of the configuration panel and set the desired dimension.
Command line options
TreeMap can be invoked from the command line with the following options::
-
-h,--help -
Show the help
-
-l, --language <argument> -
Set the default language
-
-e, --expert -
Run TreeMap in expert mode
-
-g, --disable-logging -
Disable logging window
-
-f, --lf <argument> -
Set the look and feel
-
-u, --uiscaling <argument> -
Scale the UI
-
-b, --label <argument> -
Set the variable to use for labeling
-
-k, --background <argument> -
Set the variable to use as background
-
-a, --groupby <argument> -
Set the variable to use to groupBy
-
-c, --color <argument> -
Set the variable to use for coloring
-
-s, --size <argument> -
Set the variable to use to display the size. The area of the nested shapes will be proportional to its values. To control the dimension of the treemap (its size in pixels), use the
--dimensionoption. -
-H, --height <argument> -
Set the variable to use to display the height
-
--colormap <argument> -
Set the colormap to use
-
--algorithm <argument> -
Set the TreeMap algorithm to use
-
--aggregation <argument> -
Set the aggregation method to use
-
--scale <argument> -
Set the scaling method to use
-
--nesting <argument> -
Set the nesting method to use
-
--ordering <argument> -
Set the ordering method to use
-
--depth <argument> -
Set the depth scheme to use
-
-labeling <argument> -
Set the labeling method to use
-
--rendering <argument> -
Set the rendering method to use
-
-d, --dimension <argument> -
Specify the dimension of the treemap (default is 608;569)
-
--dpi <argument> -
Set the output image resolution (only for raster output formats, default is 72). With a specified DPI of 144, the output file dimension will be 1216x1138 for the default dimension, but will look identical (but more precise) than the 72 DPI version.
-
--settings <argument> -
Load a particular settings file
-
--out <argument> -
Specify the output file. The format is determined automatically from the file extension. Supported formats are PNG, JPEG, GIF, TIFF, SVG, PDF, Postscript, EMF.
Glossary
- Item
-
A single, implicitly structured data item in a table. Synonym for row, entry, record, observation, …
- Number
-
Synonym for numerical, continuous, …
- Shape
-
A graphical element in the treemap that correspond to an item in the data. Synonym for graphical object, element, item, node, area, rectangle, …
- Text
-
Synonym for categorical, string, discrete …
- Value
-
Synonym for cell
- Variable
-
A value that can change for each item. A variable can be of type text, number, date, URL, color, and image. Synonym for column, field, attribute, …
Bibliography
-
[Shneiderman1992] Ben Shneiderman (1992). "Tree visualization with tree-maps: 2-d space-filling approach". ACM Transactions on Graphics. 11: 92–99. doi:10.1145/102377.115768.